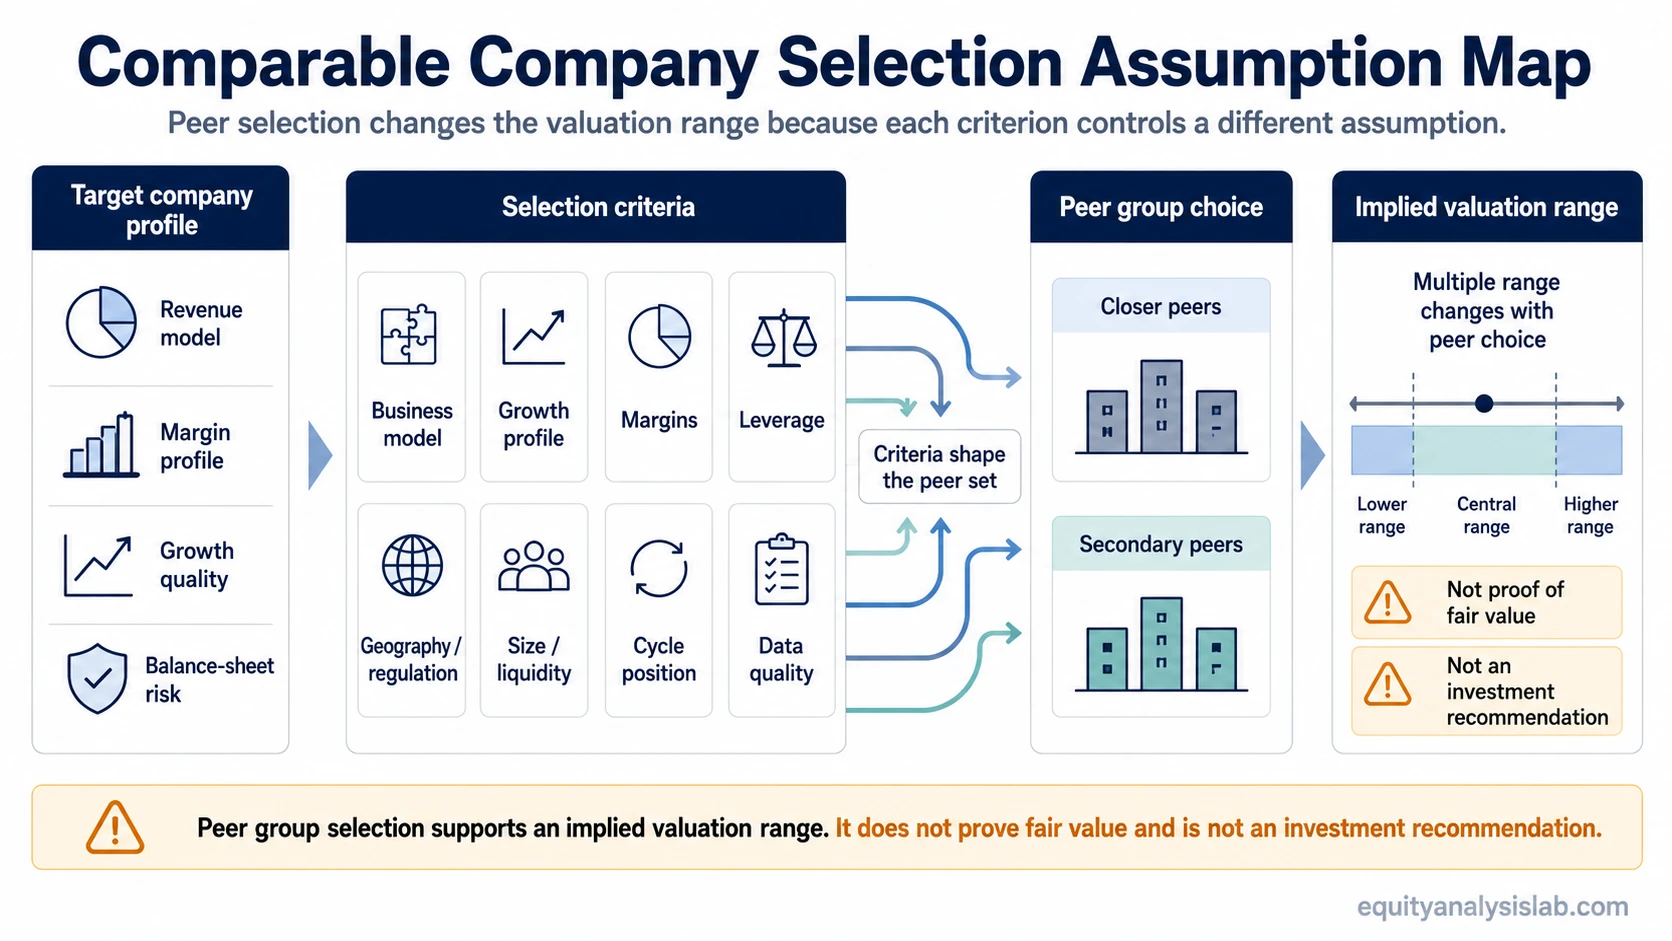
Choose comparable companies by matching the target company to peers with similar business models, growth profiles, margins, leverage, geography, regulation, and cycle exposure. The goal is not to find identical companies. The goal is to decide which market multiples are relevant enough to use in comparable company analysis.
A peer group is a valuation assumption. If the selected companies have higher growth, stronger margins, lower leverage, or cleaner revenue quality than the target company, the implied valuation can look too high. If the peer group is weaker than the target company, the same valuation work can look too conservative.
What comparable-company selection means
Comparable-company selection is the process of deciding which public companies provide a useful market reference for valuing another company. A comparable company does not need to be identical, but it should face similar enough economics that its valuation multiple says something useful about the target company.
The strongest peer set usually combines business similarity with financial similarity. Industry label alone is not enough. A software company selling subscriptions, a software company selling one-time licenses, and a software-enabled services company can all share an industry label while carrying different revenue durability, margin, and growth assumptions.
Criteria for choosing comparable companies
The cleanest way to choose comparable companies is to ask what assumption each peer controls. A peer is useful when it helps answer a valuation question. It is less useful when it only looks similar at the headline level.
| Selection criterion | Valuation assumption controlled | What can go wrong if ignored |
|---|---|---|
| Business model | How revenue is earned, repeated, retained, and protected | A company with recurring revenue may be compared with a transactional business that deserves a different multiple. |
| End market and customers | Demand drivers, customer concentration, pricing power, and cyclicality | Peers exposed to different buyers or budget cycles can distort the implied range. |
| Growth profile | How much future expansion the market is pricing into the multiple | High-growth peers can make a slower target look undervalued when the difference is really growth quality. |
| Profitability and margins | Operating efficiency, scale economics, and business quality | Low-margin and high-margin companies may trade at different multiples for structural reasons. |
| Capital intensity | How much reinvestment is needed to sustain growth | Asset-heavy peers may not be comparable with asset-light businesses even when revenue growth looks similar. |
| Capital structure | Financial risk, interest burden, and equity value sensitivity | A highly levered company may appear cheap on equity metrics while carrying more balance-sheet risk. |
| Geography and regulation | Country risk, tax exposure, regulation, reporting comparability, and market maturity | Peers in different regulatory or regional environments may deserve different discount or premium assumptions. |
| Size and liquidity | Scale, market access, investor base, and public-market depth | Small or illiquid peers can trade at multiples that reflect size and liquidity discounts, not operating similarity. |
| Cycle position | Whether current earnings are normal, depressed, or peak-cycle | Peak-cycle peers can make the target appear cheaper than it is on normalized earnings. |
| Data quality | Whether the metric is measured consistently across the peer group | Different accounting treatments or one-time items can create false precision in the multiple range. |
How each criterion changes the valuation assumption
Peer selection changes valuation because a multiple is not just a number. It can reflect the market’s view of growth, risk, profitability, capital needs, and durability. A higher EV/EBITDA multiple may reflect better margins, stronger recurring revenue, lower cyclicality, or lower reinvestment needs. A lower multiple may reflect weaker growth, balance-sheet risk, customer concentration, or lower earnings quality.
That means the analyst should not only ask whether a peer is in the same industry. The better question is whether the peer’s multiple is pricing a business profile that the target company can reasonably share.
For example, two companies may both sell industrial equipment. One may earn recurring aftermarket revenue with stable margins, while the other depends on new project cycles. Treating both as equal peers can hide a real difference in revenue durability and cyclicality.
Illustrative peer-group example
Assume a target company has $100 million of EBITDA. One possible peer group trades around 8x EBITDA, while another trades around 12x EBITDA.
| Peer group choice | Multiple used | Target EBITDA | Implied enterprise value | Interpretation issue |
|---|---|---|---|---|
| Lower-growth, cyclical peers | 8x | $100 million | $800 million | May be too conservative if the target has stronger recurring revenue or better margins. |
| Higher-growth, higher-margin peers | 12x | $100 million | $1.2 billion | May be too optimistic if the target does not share the same growth quality or profitability. |
The difference is not a mathematical error. It comes from the peer assumption. The same target metric creates a different implied valuation when the peer group prices a different business profile.
Common mistakes when selecting comparable companies
The most common mistake is choosing peers by industry label only. Industry is a starting point, not a valuation conclusion. A peer group should be narrowed by the economics that drive the multiple.
- Industry-only peer selection: Companies can share a sector but have different revenue models, margin structures, growth durability, or balance-sheet risk.
- Size mismatch: A large, liquid market leader may trade at a premium that a smaller target cannot justify without similar scale advantages.
- Growth mismatch: Using high-growth peers for a slower target can convert a growth premium into a false valuation signal.
- Margin mismatch: A low-margin target may not deserve the same multiple as peers with stronger operating leverage or pricing power.
- Leverage mismatch: Debt can change equity risk, interest burden, and comparability across valuation metrics.
- Peak-cycle earnings: Cyclical companies can look cheap when earnings are temporarily elevated.
- Mixed-quality peer sets: Combining premium companies and distressed companies without explanation can create a wide range that looks analytical but says little.
When to exclude or down-weight a comparable company
A company should usually be excluded when its economics are too different to support the valuation question. Different business models, unusual accounting, distressed balance sheets, major one-time events, or a different regulatory regime can make the peer more misleading than useful.
Down-weighting is different from excluding. A peer may still be useful if it shares some important traits but differs on one or two dimensions. In that case, it can remain in the analysis with a clear explanation of why its multiple deserves less weight.
| Peer issue | Better treatment | Reason |
|---|---|---|
| Different core business model | Exclude | The multiple may price a different revenue and margin structure. |
| Similar business but much faster growth | Down-weight or separate into a premium group | The peer may still be informative, but the growth premium should not be applied mechanically. |
| Temporary earnings distortion | Normalize, down-weight, or exclude | The current metric may not represent sustainable earnings power. |
| Major accounting or data inconsistency | Exclude unless adjustments are reliable | The comparison may look precise while the underlying metric is not comparable. |
Limitations of comparable-company selection
Comparable-company selection can narrow the valuation question, but it cannot prove fair value. A peer group shows how the market prices selected business profiles at a point in time. It does not prove that the market is correct, that the target deserves the same multiple, or that the implied value is an investment recommendation.
Pure-play peers can be rare, especially when public companies operate across multiple segments, regions, customer groups, or revenue models. In those cases, a clean peer group may require several subgroups rather than one blended average.
Comparable companies should also not replace direct analysis of the target company. If the valuation depends heavily on long-term cash-flow assumptions, reinvestment needs, or terminal assumptions, a separate discounted cash flow analysis may frame the question differently.
A practical sequence for choosing peers
Start with the closest business model, then test whether the financial profile supports the comparison. A useful order is: business model, customer/end-market exposure, growth, margins, capital intensity, leverage, geography, cycle position, and data quality.
After that, separate the peer group into tiers. The closest peers can carry the most weight. Secondary peers can provide context. Outliers should be explained, adjusted, down-weighted, or removed rather than quietly blended into the average.
The final peer set should make the valuation logic easier to understand. If the group needs too many exceptions, it may be signaling that the target company should be valued with more than one method or with multiple peer subsets.
FAQ
How many comparable companies should be used?
There is no fixed number that works for every valuation. A smaller group of highly relevant peers is usually more useful than a larger group that mixes different business models, growth profiles, or risk levels.
Should comparable companies be in the same industry?
They should usually share an industry or end-market link, but industry alone is not enough. Business model, growth, margins, leverage, geography, and cycle position often matter more than the label.
Can a peer group prove what a company is worth?
No. A peer group can support an implied valuation range, but it does not prove fair value. The result depends on the peer set, the selected metric, the quality of the data, and the assumptions behind the comparison.