
Relative valuation is a market-comparison valuation method that estimates value by applying peer or transaction multiples to a relevant company metric. The estimate depends on the comparison set, the selected multiple, denominator quality, capital structure, and assumptions about how similar the businesses really are.
The method is not a shortcut to a final investment decision. It helps frame whether a company looks expensive, cheap, or broadly in line with similar assets after differences in growth, profitability, leverage, accounting quality, and business risk are considered.
What Relative Valuation Means
Relative valuation estimates a company’s value by comparing it with similar companies or transactions using standardized valuation multiples. Common multiples include price-to-earnings, enterprise value to EBITDA, enterprise value to revenue, price-to-book, and price-to-free-cash-flow.
The method is relative because the estimate is anchored to market prices paid for comparable assets. That makes it different from an intrinsic cash-flow model, where the analyst estimates value from projected cash flows and a discount rate. Relative valuation asks what the market is paying for similar earnings, revenue, assets, or cash flow, then applies that comparison to the company being reviewed.
Key Points
- Relative valuation estimates value by comparing a company with similar companies or transactions.
- The chosen multiple must match the metric and the capital scope of the analysis.
- Enterprise-value multiples and equity-value multiples follow different calculation paths.
- Peer selection, peer aggregation, denominator quality, and capital-structure adjustments can materially change the result.
- The output is an estimate for review, not a standalone investment conclusion.
How Relative Valuation Works
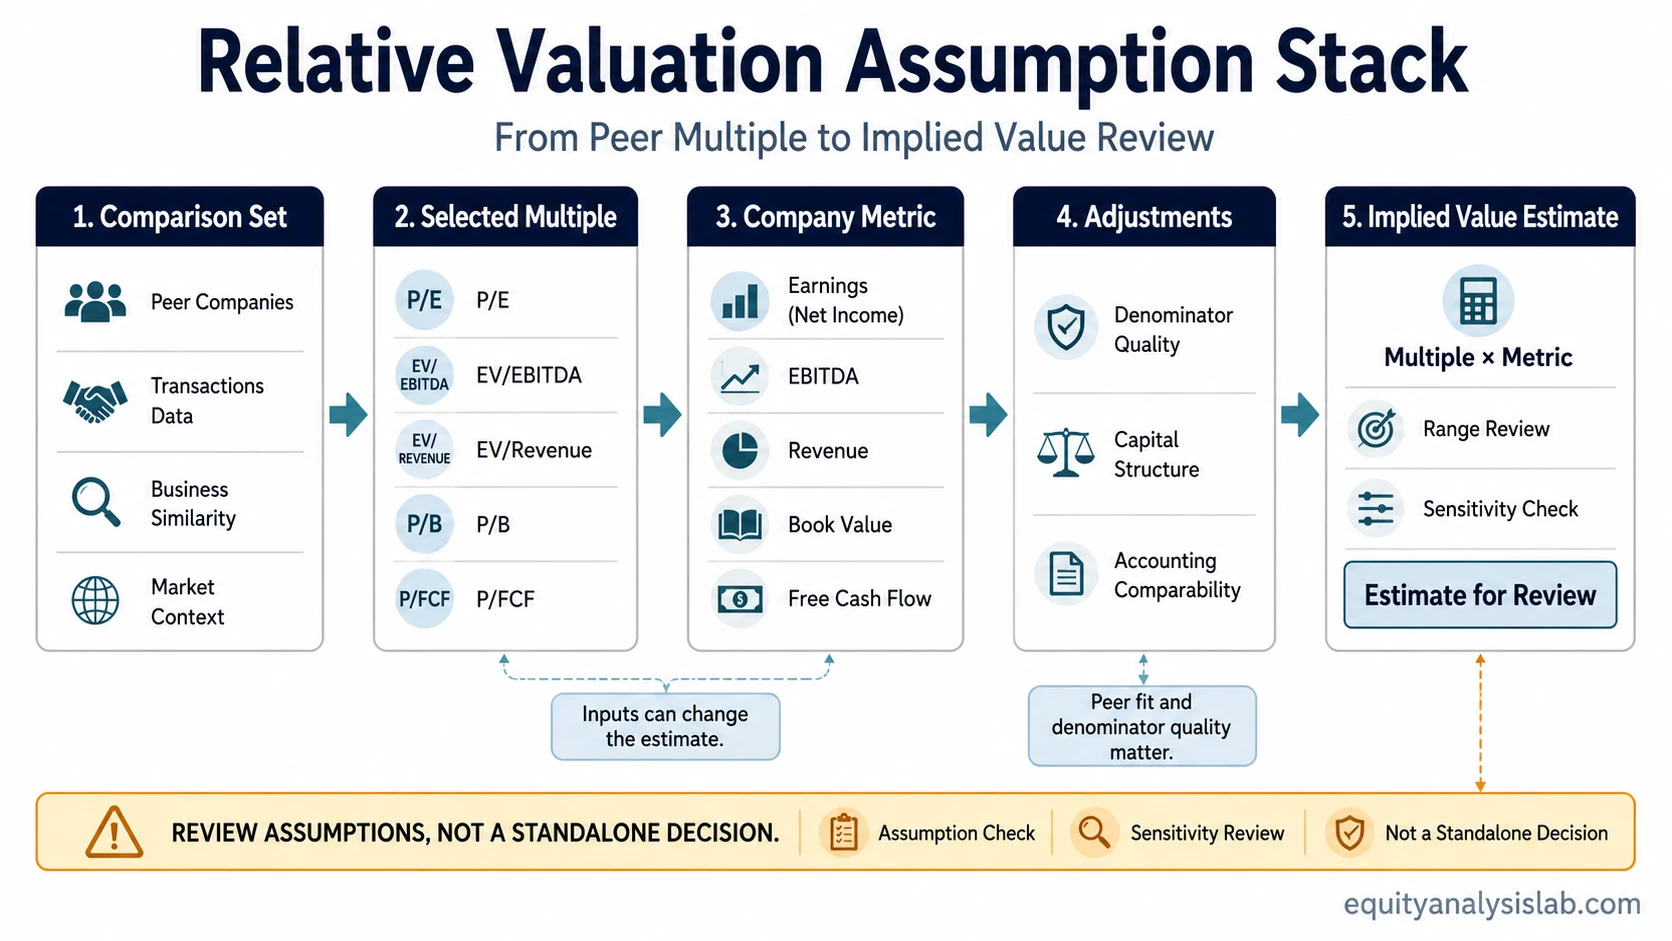
Relative valuation usually follows four linked steps. The analyst chooses a comparison set, selects a multiple, checks whether the denominator is comparable and durable, and then applies the selected reference multiple to the company’s own metric.
| Step | Question | Why It Matters |
|---|---|---|
| Choose the comparison set | Which peers or transactions are genuinely comparable? | The estimate is only as useful as the comparison set behind it. |
| Select the multiple | Should the comparison use earnings, EBITDA, revenue, book value, or free cash flow? | Different multiples emphasize different parts of the business model. |
| Check the denominator | Is the metric normalized, recurring, and comparable across companies? | A distorted denominator can make a multiple look more meaningful than it is. |
| Apply the reference multiple | What value is implied by the selected multiple and the company metric? | The output is an implied value estimate, not a final verdict. |
A detailed peer-based implementation belongs to comparable company analysis. Relative valuation is the broader method family. Comparable company analysis is one structured way to apply it rather than a different meaning of the same estimate.
Relative Valuation Formula Paths
The simplified phrase “multiple × metric = implied value” is directionally useful, but the calculation path depends on whether the selected multiple is built on enterprise value or equity value.
| Multiple Type | Example Multiples | Initial Output | Next Step |
|---|---|---|---|
| Enterprise-value multiple | EV/EBITDA, EV/EBIT, EV/Revenue | Implied enterprise value | Adjust for net debt and other relevant claims to reach implied equity value, then divide by shares if per-share value is needed. |
| Equity-value multiple | P/E, P/FCF, P/B | Implied equity value or implied value per share | No EV-to-equity bridge is required if the denominator already belongs to common equity. |
Matching rule: the capital scope of the multiple should match the capital scope of the metric. Enterprise-value multiples should be paired with operating metrics. Equity-value multiples should be paired with metrics that belong to common shareholders.
Relative Valuation Worked Example: From Peer Multiple to Value per Share
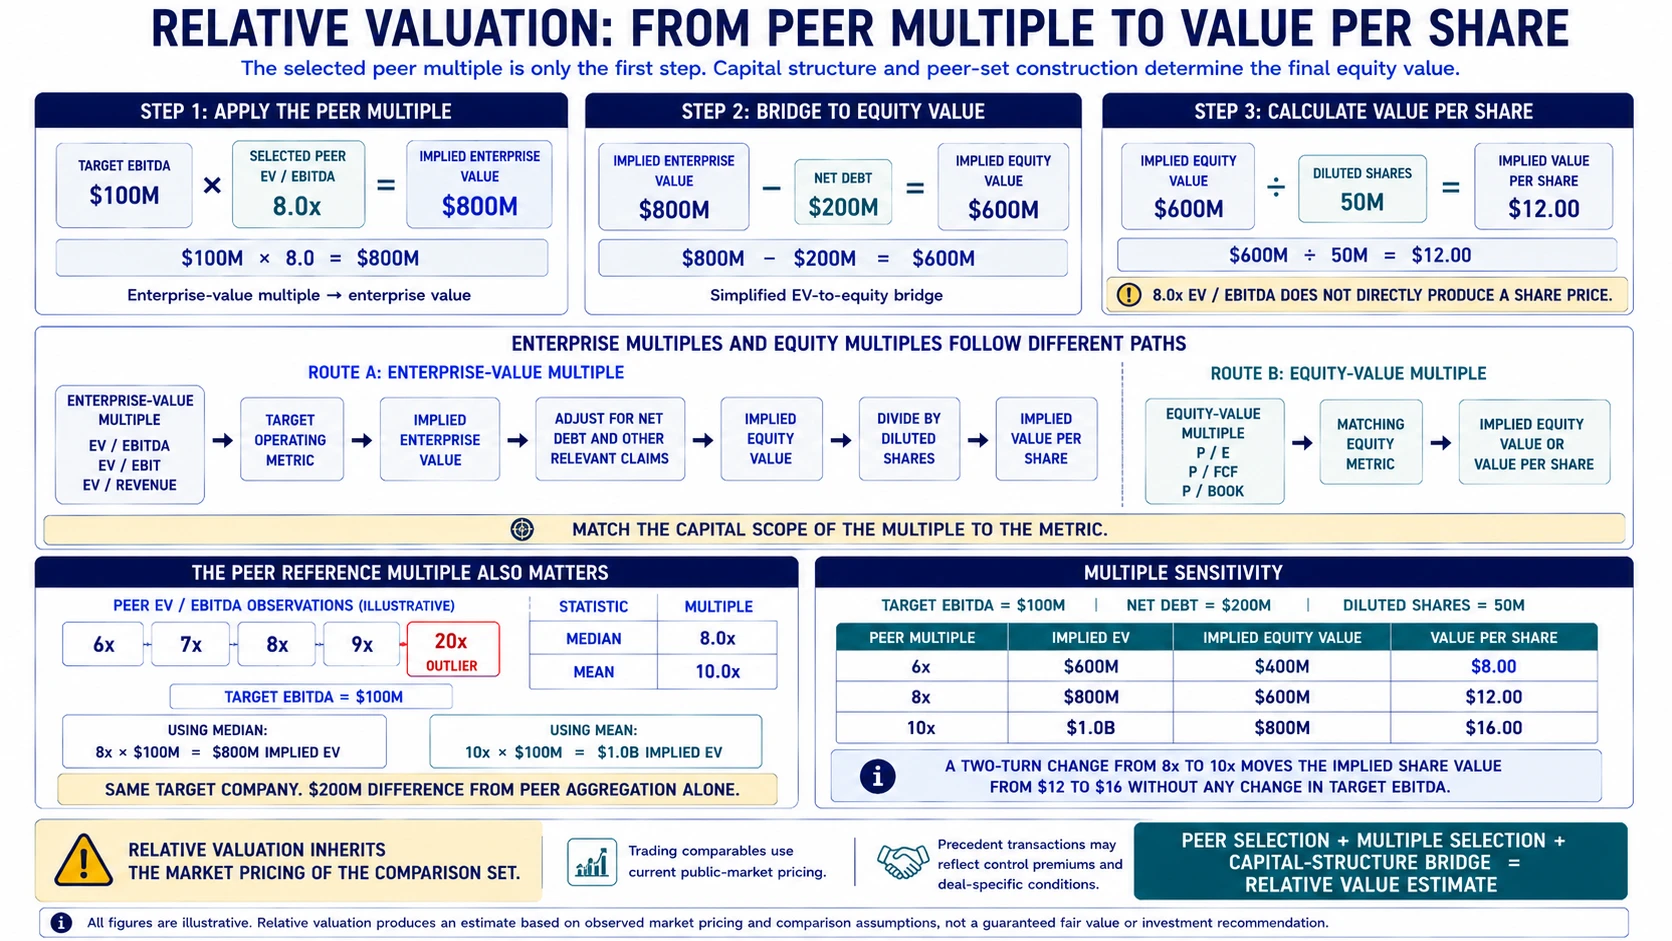
Consider a hypothetical target company with EBITDA of $100 million, net debt of $200 million, and 50 million diluted shares outstanding. Assume the selected peer EV/EBITDA multiple is 8.0x.
| Step | Calculation | Illustrative Result |
|---|---|---|
| Implied enterprise value | 8.0 × $100 million EBITDA | $800 million |
| Implied equity value | $800 million – $200 million net debt | $600 million |
| Implied value per share | $600 million ÷ 50 million diluted shares | $12.00 per share |
The example shows why an enterprise-value multiple does not directly produce a share price. The multiple first implies enterprise value. Net debt and other relevant claims then determine how much of that value belongs to common equity, and only after that can an implied per-share value be calculated.
Relative Valuation Multiples
Different multiples answer different comparison questions. Price-to-earnings compares equity value with accounting earnings. EV/EBITDA compares enterprise value with operating earnings before depreciation and amortization. EV/Revenue is sometimes used when earnings are weak or temporarily distorted, but it says less about profitability. Price-to-book can matter for asset-heavy or financial businesses, while price-to-free-cash-flow focuses on cash generation available after capital spending.
No multiple is universally better. The right multiple depends on what drives value in the business and whether the underlying metric is comparable. A software company, a bank, a retailer, and a commodity producer may require different comparison lenses because their economics, balance sheets, and accounting profiles are different.
Mean vs Median Peer Multiple
Relative valuation also depends on how peer observations are summarized. A mean and a median can produce different reference multiples, especially when the peer set contains outliers.
Assume peer EV/EBITDA observations are 6x, 7x, 8x, 9x, and 20x.
| Peer Observations | Reference Statistic | Result |
|---|---|---|
| 6x, 7x, 8x, 9x, 20x | Median | 8.0x |
| 6x, 7x, 8x, 9x, 20x | Mean | 10.0x |
If the target company still has $100 million of EBITDA, the median implies enterprise value of $800 million while the mean implies $1.0 billion. The target company did not change. The estimate changed because the peer aggregation changed.
Diagnostic point: a single outlier in the peer group can materially affect the estimate when the reference multiple is based on the mean rather than the median.
Assumption Sensitivity in Relative Valuation
Small changes in the selected peer multiple can move the implied value estimate materially. That is why relative valuation is usually more useful as a range or diagnostic framework than as a single precise number.
Assume the target company still has $100 million of EBITDA, $200 million of net debt, and 50 million diluted shares outstanding.
| Peer Multiple | Implied Enterprise Value | Implied Equity Value | Implied Value Per Share |
|---|---|---|---|
| 6.0x | $600 million | $400 million | $8.00 |
| 8.0x | $800 million | $600 million | $12.00 |
| 10.0x | $1.0 billion | $800 million | $16.00 |
The target company’s EBITDA did not change, but the implied per-share value moved from $8.00 to $16.00 as the reference multiple moved from 6.0x to 10.0x. That sensitivity is one reason relative valuation should be read together with the peer set and the assumptions behind it.
Inputs and Assumptions Behind Relative Valuation
Relative valuation can look simple because the visible output is often a single multiple or range. A peer average can still be misleading if the companies differ materially in growth, margin structure, capital intensity, leverage, accounting treatment, cyclicality, or business quality.
| Input | What to Check | Risk if Ignored |
|---|---|---|
| Peer group | Business model, geography, scale, margin profile, growth, cyclicality, and customer mix | The company may be compared with businesses that deserve different multiples. |
| Selected multiple | Whether the metric matches the company’s economics and capital structure | The multiple may emphasize the wrong part of the business. |
| Denominator quality | Normalized earnings, recurring EBITDA, revenue quality, book value relevance, or free cash flow durability | A low multiple may come from inflated or non-recurring metrics. |
| Capital structure | Debt, cash, lease obligations, preferred securities, and minority interests where relevant | Enterprise value and equity value may be mixed incorrectly. |
| Accounting comparability | Revenue recognition, depreciation policy, stock-based compensation, one-time items, and adjustments | Reported metrics may not be comparable across companies. |
| Market pricing context | Sector cycle, interest-rate environment, risk appetite, and market-wide multiple levels | The peer group may be expensive or cheap as a group. |
Trading Comparables vs Transaction Multiples
Relative valuation can use different market references. Public trading multiples and precedent transaction multiples belong to the same method family, but they do not represent the same pricing context.
| Reference Type | What It Uses | Important Boundary |
|---|---|---|
| Trading comparables | Current public-market multiples of listed companies | These reflect minority public-market pricing at current market conditions. |
| Precedent transactions | Multiples observed in completed acquisitions | These may include control premiums and deal-specific conditions. |
The distinction matters because the market reference affects the estimate. A transaction multiple may be higher than a trading multiple for reasons that do not apply to ordinary public-market peer comparison.
Relative Valuation vs Intrinsic Valuation
Relative valuation is market-based. It compares a company with similar public companies or transactions and asks what the market is paying for comparable earnings, revenue, assets, or cash flow. Intrinsic valuation estimates value from the company’s own projected cash flows, required return, and long-term assumptions.
The discounted cash flow method is one common intrinsic valuation approach. Its mechanics are different because the estimate depends on projected cash flows, discount rate, and terminal value rather than a peer multiple.
The discounted cash flow formula is a separate calculation structure and should not be treated as the same method as peer-based multiple comparison.
Both approaches can be useful because they test different assumptions. Relative valuation asks whether market pricing for similar assets supports the estimate. Intrinsic valuation asks whether the company’s own cash-flow profile supports the estimate.
Where Relative Valuation Can Mislead
A company trading at a discount to peers is not automatically undervalued. The discount can reflect weaker growth, lower margins, higher leverage, weaker earnings quality, customer concentration, poor capital allocation, accounting differences, or higher business risk. A premium multiple is not automatic proof of quality either.
Relative valuation can also mislead when the whole peer group is mispriced. If a sector is priced aggressively, a company can look reasonable relative to peers while still being expensive under more conservative assumptions. If a sector is depressed, a company can look cheap without having a clear catalyst or durable advantage.
The strongest use of relative valuation is comparative and diagnostic. It can highlight where assumptions need review, but it does not prove fair value, predict returns, or replace business-quality analysis.
How Investors Can Use the Estimate
Relative valuation is most useful when it is treated as one input in a broader valuation process. A useful review asks whether the peer group is credible, whether the chosen multiple fits the business, whether the denominator is durable, whether capital-structure adjustments are handled correctly, and whether the implied value remains reasonable under different assumptions.
The output should be read as an estimate for review, not as a buy or sell signal. A low multiple can raise a question. It does not answer the question by itself.
Related Valuation Methods
Relative valuation often sits beside other valuation methods rather than replacing them. Peer multiples can be compared with a DCF result, transaction multiples, or an asset-based method to test whether the valuation conclusion depends too heavily on one assumption set.
For diversified companies, conglomerates, or businesses with materially different segments, valuing separate business segments may be more useful than applying one blended multiple to the entire company.
FAQ
What is relative valuation?
Relative valuation estimates value by comparing a company with similar companies or transactions using standardized multiples such as price-to-earnings, EV/EBITDA, EV/Revenue, price-to-book, or price-to-free-cash-flow.
How is relative valuation calculated?
The calculation path depends on the multiple used. An enterprise-value multiple such as EV/EBITDA produces implied enterprise value first, which then needs an EV-to-equity bridge before implied value per share can be calculated. An equity-value multiple such as P/E directly relates to common equity.
What makes a peer group comparable?
A peer group is more comparable when the companies have similar business models, growth rates, margins, capital intensity, accounting profiles, leverage, geography, and risk characteristics. A weak peer group can distort the valuation estimate.
Why can mean and median peer multiples produce different results?
They summarize the same peer set differently. A mean can be pulled upward or downward by outliers, while a median is often less sensitive to a single extreme observation.
Is a company undervalued if it trades below peer multiples?
Not automatically. A lower multiple can reflect mispricing, but it can also reflect weaker growth, lower margins, higher leverage, poorer earnings quality, accounting differences, or higher business risk.