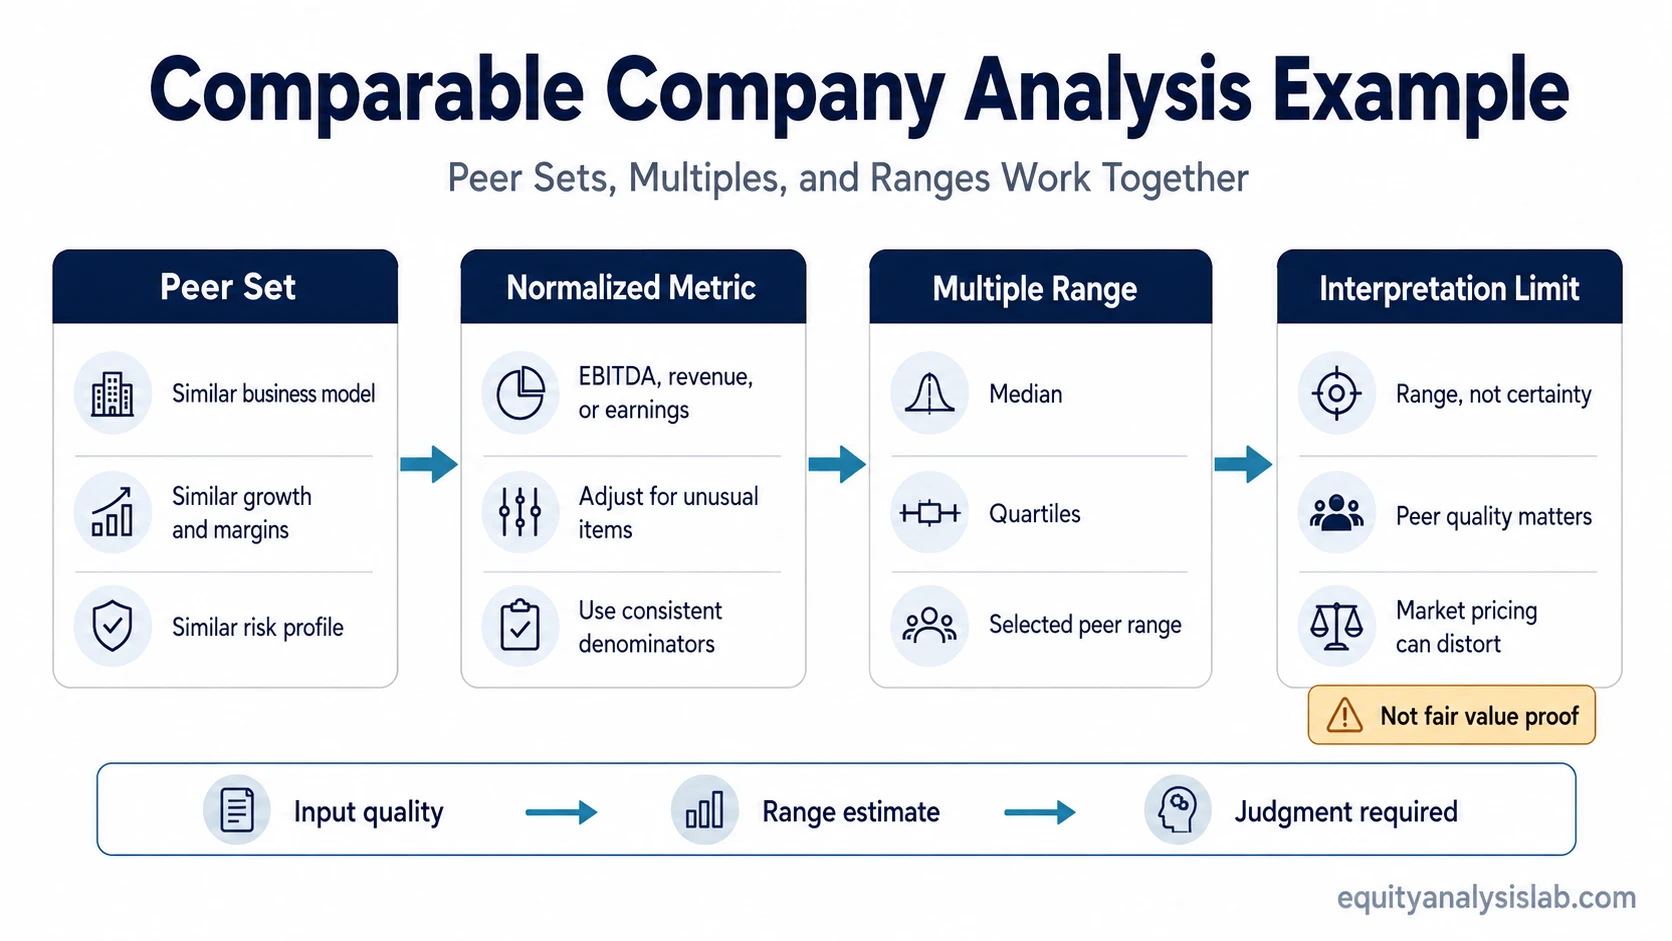
A comparable company analysis example shows how peer selection, normalized valuation multiples, and assumptions create a valuation range rather than a certain fair value or investment recommendation.
Comparable company analysis is a relative valuation method. It compares one company with similar public companies and uses their market valuation multiples as reference points.
The result is a valuation estimate, not proof that the company is attractive or unattractive as an investment. The range is only as useful as the peer group, financial metric, normalization choices, and multiple interpretation behind it.
Key Points
- A comparable company analysis example starts with the peer group, not the final number.
- Peer selection, normalized metrics, and outlier treatment can change the valuation range materially.
- Median and quartile ranges are usually safer than one precise point estimate.
- A low multiple is not automatically cheap if growth, margins, leverage, or business quality are weaker.
- The example is most useful when it shows the assumptions behind the valuation range, not only the final implied value.
What a Comparable Company Analysis Example Answers
A comparable company analysis example answers a relative valuation question: how would the market value this company if it were priced in line with similar public companies?
The method does not calculate intrinsic value from first principles. It looks at market pricing for comparable companies, then applies selected valuation multiples to the company being analyzed.
Simple definition: Comparable company analysis estimates a valuation range by comparing a company with similar public peers and applying their valuation multiples to a normalized financial metric.
The peer group does most of the work. Industry similarity matters, but it is not enough. A useful peer set should also consider geography, size, growth profile, margin structure, capital intensity, leverage, and business risk.
Inputs Used in a Comparable Company Analysis Example
The example becomes clearer when each input has a defined job. A peer multiple is not useful by itself unless the denominator and comparison group are also reasonable.
| Input | Role in the example | Why it matters |
|---|---|---|
| Target company | The company being valued | Its revenue, EBITDA, earnings, or other metric becomes the base for the calculation. |
| Peer group | The reference companies | Peers set the market multiple range used for comparison. |
| Valuation multiple | The market pricing ratio | Common examples include EV/EBITDA, EV/Revenue, P/E, and other metric-specific ratios. |
| Normalized metric | The denominator applied to the multiple | One-time items, unusual margins, cyclicality, and accounting distortions can make raw numbers misleading. |
| Range selection | The output band | Median, quartile, or selected peer ranges are usually more useful than one precise number. |
The same company can look different under different multiples. That does not automatically mean one method is right and another is wrong. It usually means the analyst must check which metric best matches how similar companies are priced.
Usable Peer Set vs Weak Peer Set
A comparable company analysis becomes more useful when the peer set reflects the economics of the company being valued. It becomes weaker when the peer group only shares a broad industry label.
| Peer set quality | What it usually means | Effect on the valuation range |
|---|---|---|
| Usable peer set | Peers share similar business model, growth profile, margin structure, leverage, and market exposure. | The range can provide a reasonable market reference, while still requiring judgment. |
| Weak peer set | Peers share the same sector label but differ materially in economics, risk, or capital intensity. | The range may be directionally informative but should not be treated as a precise valuation anchor. |
| Misleading peer set | Peers are selected mainly to justify a preferred valuation result. | The output can look analytical while being driven by selection bias. |
Step-by-Step Comparable Company Analysis Example
Consider a simplified company with $100 million of normalized EBITDA. A selected peer group trades between 8.0x and 12.0x EV/EBITDA, with a median multiple of 10.0x.
Illustrative calculation:
- Target company normalized EBITDA: $100 million
- Low peer multiple: 8.0x
- Median peer multiple: 10.0x
- High peer multiple: 12.0x
- Implied enterprise value range: $800 million to $1.2 billion
- Median-implied enterprise value: $1.0 billion
This does not mean the company is definitely worth $1.0 billion. It means that if the company were valued in line with the selected peer median, its enterprise value would be approximately $1.0 billion before further adjustments.
Because the EV/EBITDA multiple produces an enterprise value first, equity value still depends on debt, cash, preferred claims, lease obligations, minority interests, dilution, and other capital-structure adjustments where relevant.
How to Interpret the Valuation Range
The range is usually more useful than the midpoint. A company might deserve a lower multiple than peers if it has weaker growth, lower margins, higher leverage, greater cyclicality, or lower earnings quality. It might deserve a higher multiple if its growth, margins, returns on capital, balance sheet, and business quality are stronger.
| Range position | Possible interpretation | What to check before relying on it |
|---|---|---|
| Below peer median | The company may be priced at a discount. | Check whether the discount reflects weaker fundamentals or higher risk. |
| Near peer median | The company may be priced broadly in line with peers. | Check whether the peer median is itself distorted by market conditions or outliers. |
| Above peer median | The company may be priced at a premium. | Check whether the premium is supported by growth, margin quality, returns, or lower risk. |
A common mistake is to treat the lowest multiple as conservative and the highest multiple as aggressive without checking why each peer trades where it does. The multiple is an output of market pricing, but the interpretation still depends on business quality and risk.
Comparable Company Analysis and Relative Valuation
Comparable company analysis is one application of relative valuation. It uses market prices from similar companies as the reference point rather than estimating value from projected cash flows alone.
This makes the method useful for understanding how the market currently prices similar businesses. It also creates a limitation: if the whole peer group is expensive, cheap, distorted by one-time conditions, or poorly matched, the result can inherit that distortion.
Important limitation: A comparable company analysis can show market-relative value, but it cannot prove intrinsic value by itself. It needs context from fundamentals, accounting quality, business model durability, and other valuation methods.
Common Mistakes in a Comparable Valuation Example
The biggest errors usually appear before the final calculation. A clean-looking table can still produce a weak result if the peer group, metric, or normalization process is flawed.
| Mistake | Why it weakens the example | Better interpretation |
|---|---|---|
| Choosing peers only by industry name | Companies in the same industry can have very different economics. | Compare business model, growth, margins, leverage, and risk profile. |
| Using one multiple as the whole answer | Different metrics capture different parts of the business. | Use the multiple that matches the business model and cross-check where needed. |
| Ignoring outliers | One distressed or unusually premium peer can distort the range. | Review median, quartiles, and reasons for extreme values. |
| Using unadjusted financials | One-time items can make EBITDA, earnings, or revenue misleading. | Normalize the metric before applying the multiple. |
| Treating the midpoint as fair value proof | The midpoint is a calculation result, not a conclusion. | Use the range as a market reference and test the assumptions behind it. |
Comparable Company Analysis vs DCF Example
A comparable company analysis example and a DCF example answer different valuation questions. The comparable approach asks how similar public companies are priced by the market. A DCF estimates value from expected future cash flows and discount-rate assumptions.
| Method | Main question | Main weakness |
|---|---|---|
| Comparable company analysis | How does the market price similar companies? | Peer selection and market mood can distort the result. |
| DCF valuation | What is the company worth based on future cash flows? | Forecasts, terminal value, and discount rates can dominate the output. |
The two methods can disagree. That disagreement is often useful because it exposes where the valuation depends on market sentiment, growth assumptions, margin durability, or required return assumptions.
When the Example Becomes Less Reliable
A comparable company analysis example becomes less reliable when the company has no clean peers, the business model is changing quickly, margins are temporarily distorted, leverage is unusual, or the peer group reflects a market cycle extreme.
Reliability check: The method is strongest when peers are truly comparable, the selected metric is economically meaningful, and the analyst explains why the chosen range is reasonable.
If those conditions are missing, the calculation can still be shown, but the conclusion should be treated as a weak market reference rather than a strong valuation answer.
Which Valuation Concept Clarifies the Example?
A comparable valuation example is easier to interpret when each related concept has a specific role. The table below separates the method, the multiple, and the broader valuation context.
| Concept | How it changes the interpretation | Use in the example |
|---|---|---|
| Comparable company analysis | Explains how peer multiples are selected and applied. | Use it to understand the full relative valuation method. |
| EV/EBITDA | Focuses on enterprise value relative to operating earnings before interest, taxes, depreciation, and amortization. | Use it when capital structure and operating profitability need to be separated. |
| Relative valuation | Frames market-based valuation methods as a group. | Use it to understand why peer pricing is different from intrinsic value modeling. |
| Price-to-earnings ratio | Compares equity value or share price with earnings. | Use it when earnings are meaningful, comparable, and not heavily distorted. |
An earnings-based comparison is often clearer after reviewing the price-to-earnings ratio, because earnings multiples can be sensitive to accounting quality, cyclicality, one-time items, and expected growth.
FAQ
Is comparable company analysis the same as relative valuation?
Comparable company analysis is one form of relative valuation. It compares a company with similar public peers and uses their market valuation multiples to estimate a range.
Why does a comparable company analysis example use a range?
The output depends on peer selection, metric normalization, multiple choice, and outlier treatment. A range is more honest than one precise number because those assumptions can change the result.
Can a low multiple mean a company is undervalued?
It can suggest a valuation question, but it does not prove undervaluation. A low multiple may reflect weaker growth, lower margins, higher leverage, cyclicality, or lower business quality.
What makes a comparable company analysis example weak?
It is weak when the peers are not truly comparable, the chosen metric is distorted, outliers drive the range, or the midpoint is treated as proof of fair value.
How is comparable company analysis different from a DCF example?
Comparable company analysis uses market multiples from similar companies. A DCF example uses projected cash flows, discount rates, and terminal assumptions. The two methods answer different valuation questions.