
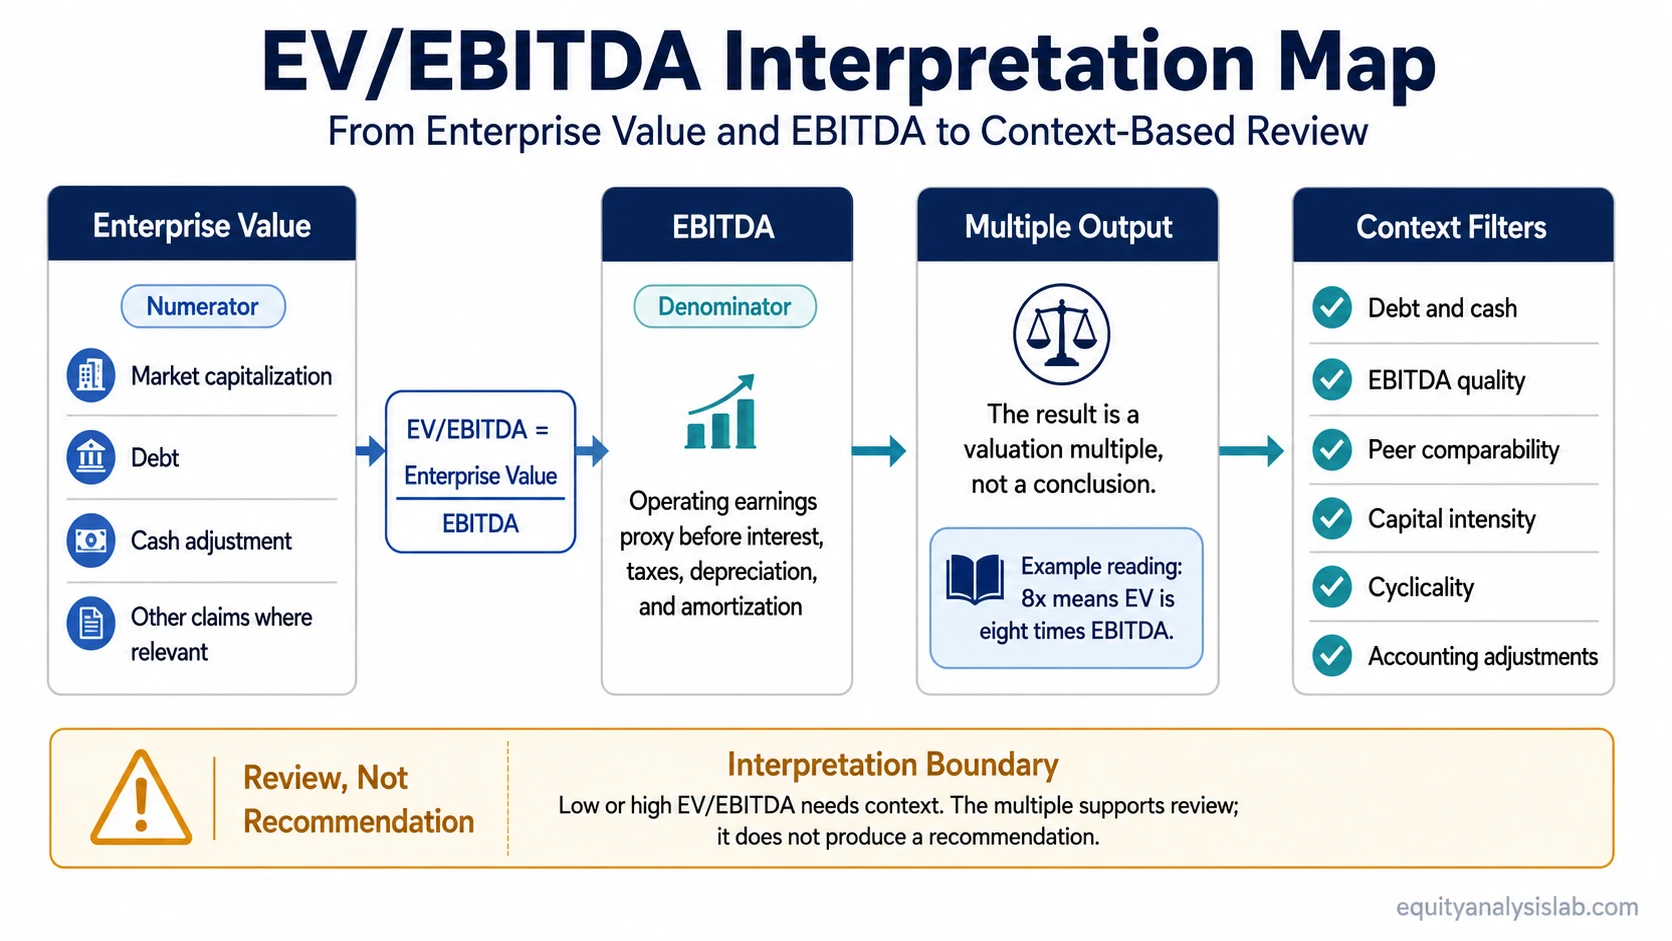
EV/EBITDA is a valuation multiple that compares enterprise value with EBITDA. It does not prove that a stock is cheap or expensive on its own, because the interpretation still depends on debt, cash, EBITDA quality, capital intensity, peer comparability, and business-cycle position.
Direct answer: EV/EBITDA means enterprise value divided by EBITDA. It shows how much the market is assigning to the whole operating business relative to a pre-interest operating earnings measure.
Formula: EV/EBITDA = Enterprise Value / EBITDA.
Key Points
- EV/EBITDA compares the value of the whole business with EBITDA, not just equity market capitalization with net income.
- It is an enterprise-value multiple, so the denominator should also be a whole-business operating measure.
- EBITDA is an operating earnings proxy, not free cash flow, because it excludes items such as capital expenditure and working-capital needs.
- A low or high EV/EBITDA multiple needs context. Net debt, cash, add-backs, cyclicality, peer selection, and business quality can all change the interpretation.
What EV/EBITDA Means
EV/EBITDA compares enterprise value with EBITDA. Enterprise value is a debt-inclusive and cash-adjusted view of what the operating business is worth to all capital providers. EBITDA is a pre-interest, pre-tax operating earnings proxy that removes depreciation and amortization from the denominator.
The result is a multiple. A company trading at 8x EV/EBITDA is being valued at eight times its selected EBITDA denominator, using enterprise value rather than equity value alone. That can make the ratio useful when two companies have different debt levels, cash balances, or financing structures.
The ratio does not remove all differences between companies. It only creates a cleaner starting point in some cases. A company with steadier demand, stronger margins, lower reinvestment needs, or more durable EBITDA may deserve a different multiple than a company with weaker earnings quality or heavier capital requirements.
EV/EBITDA Formula
EV/EBITDA = Enterprise Value / EBITDA
Enterprise value, simplified: market capitalization + debt – cash and cash equivalents.
Enterprise value, fuller review: market capitalization + debt + preferred equity + minority interest and other relevant claims – cash and cash equivalents.
| Formula part | What it represents | Interpretation risk |
|---|---|---|
| Enterprise value | The value of the operating business to equity and debt holders, usually adjusted for cash and debt. | Debt, cash, preferred equity, minority interest, leases, pension obligations, and other claims can change the numerator. |
| EBITDA | Earnings before interest, taxes, depreciation, and amortization. | EBITDA can overstate economic earnings when capital expenditure, working capital, or aggressive add-backs are material. |
| EV/EBITDA multiple | The number of times enterprise value covers EBITDA. | The number is not meaningful without peer context, EBITDA quality, and business-cycle context. |
A simplified enterprise value calculation is often written as market capitalization plus debt minus cash. In more complete analysis, preferred equity, minority interest, leases, pension obligations, or other claims may also matter. The exact inputs should match the purpose of the comparison.
EV/EBITDA Worked Example: From Market Cap to the Multiple
Consider an illustrative company with the following inputs:
| Input | Illustrative Amount |
|---|---|
| Market capitalization | $3.0 billion |
| Debt | $1.5 billion |
| Preferred equity | $0.2 billion |
| Minority interest | $0.1 billion |
| Cash | $0.8 billion |
The enterprise value calculation is:
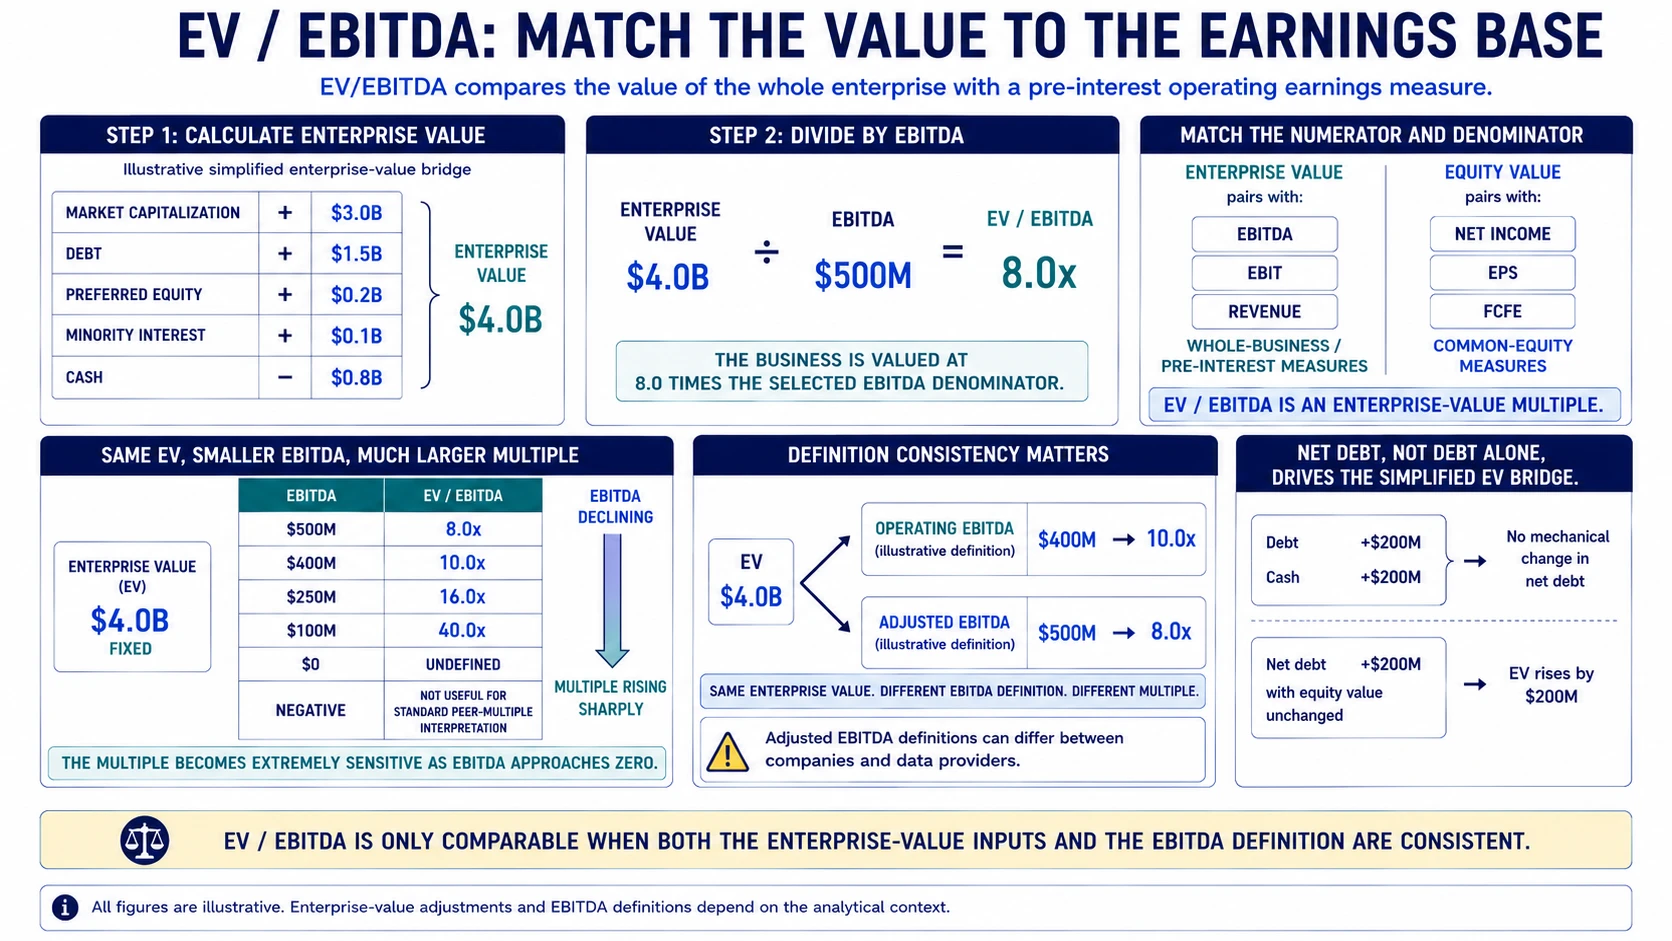
Enterprise Value = $3.0B + $1.5B + $0.2B + $0.1B – $0.8B = $4.0B
Now assume EBITDA is $500 million.
EV/EBITDA = $4.0B ÷ $0.5B = 8.0x
That means the operating business is being valued at 8.0 times the selected EBITDA denominator in this simplified example. The figure is descriptive, not a verdict that the company is cheap or expensive.
Why EV/EBITDA Is an Enterprise-Value Multiple
EV/EBITDA is built from enterprise value, so it should be matched with a denominator that also refers to the whole operating business rather than only to common equity holders.
| Numerator type | Compatible denominator examples |
|---|---|
| Enterprise value | EBITDA, EBIT, Revenue |
| Equity value | Net income, EPS, FCFE |
This is why EV/EBITDA is an enterprise-value multiple rather than an equity-value multiple. The ratio is designed to compare the value of the whole business with an operating earnings base before financing effects.
What EV/EBITDA Tells Investors
EV/EBITDA helps investors compare how the market values operating earnings across companies. Because enterprise value includes debt and adjusts for cash, the ratio can be more useful than equity-only metrics when companies have different financing structures.
The multiple is often used in relative valuation. An investor might compare several companies in the same sector, then ask whether one business has a lower or higher EV/EBITDA multiple because of growth, margins, leverage, capital intensity, cyclicality, or earnings quality.
The useful question is not simply whether the number is low or high. The better question is what the multiple is assuming about the durability of EBITDA, the quality of the business, the balance sheet, and the peer group being used.
Why EV/EBITDA Becomes Unstable When EBITDA Approaches Zero
The same enterprise value can produce very different multiples if the EBITDA denominator changes. That is why EV/EBITDA becomes less useful when EBITDA is very small, zero, or negative.
| Enterprise Value | EBITDA | EV/EBITDA |
|---|---|---|
| $4.0 billion | $500 million | 8.0x |
| $4.0 billion | $400 million | 10.0x |
| $4.0 billion | $250 million | 16.0x |
| $4.0 billion | $100 million | 40.0x |
| $4.0 billion | $0 | Undefined |
| $4.0 billion | Negative | Mathematically possible, but generally not useful for standard peer-multiple interpretation |
The table shows why a multiple can become extreme when EBITDA gets small. A business with weak or near-zero EBITDA may require a different valuation lens instead of forcing a ratio that becomes unstable.
Definition Consistency Matters
EV/EBITDA can look precise while hiding inconsistent definitions. The enterprise-value numerator and the EBITDA denominator both need to be defined consistently across companies and across data sources.
Important boundary: Net debt, not debt alone, drives the simplified enterprise-value bridge. If debt rises but cash rises by the same amount, enterprise value does not mechanically increase by that full debt amount.
The EBITDA definition matters as well. A provider-derived operating EBITDA proxy, a pre-tax-derived reconstruction, and a company-reported Adjusted EBITDA can all produce different numbers even for the same company and the same period.
When EV/EBITDA Is Useful
EV/EBITDA is most useful when the analyst is comparing businesses with similar operating models and reasonably positive EBITDA. It can help separate operating valuation from capital structure because enterprise value includes debt and adjusts for cash.
The ratio can be especially useful in peer comparison when net income is affected by interest expense, tax differences, or depreciation and amortization patterns. In that setting, EV/EBITDA can create a cleaner operating comparison than a metric based only on earnings available to common shareholders.
That does not make EV/EBITDA universally better than other multiples. If depreciation and amortization are economically important, EV/EBIT can give a stricter view because it keeps depreciation and amortization in the profit measure. If EBITDA is weak, negative, or unstable, an EV/Revenue multiple may sometimes be more useful as a rougher revenue-based comparison.
When EV/EBITDA Can Mislead
EV/EBITDA can mislead when the denominator does not reflect durable operating economics. EBITDA excludes capital expenditure, working-capital needs, interest, taxes, depreciation, and amortization, so it should not be treated as the same thing as free cash flow.
Common mistake: A low EV/EBITDA multiple can reflect risk rather than opportunity. It may point to leverage, weak EBITDA quality, heavy reinvestment needs, declining demand, cyclicality, or a peer-group mismatch.
The ratio is also less useful when EBITDA is negative, highly cyclical, or heavily adjusted. For financial companies, enterprise value and EBITDA may not map cleanly to the economics of the business because debt can function more like operating capital than ordinary financing.
Adjusted EBITDA requires particular care. Add-backs can be reasonable when they remove genuine one-time items, but they can also make recurring earnings look stronger than they are. The more adjustments are needed to make EBITDA usable, the more the multiple depends on judgment rather than a simple formula.
Lyft Example: Why EBITDA Can Produce Different Answers
A negative EBITDA figure for Lyft is not necessarily a data error. The answer can change because Lyft reports Adjusted EBITDA, while investors and data providers may also reconstruct EBITDA from different starting lines. The label may look similar even though the underlying calculation is different.
Common misunderstanding: company-reported Adjusted EBITDA, operating-income-derived EBITDA proxy, and pre-tax-derived EBITDA reconstruction are not interchangeable measures.
| EBITDA measure | FY2025 | Q1 2026 | What the calculation captures |
|---|---|---|---|
| Operating-income-derived EBITDA proxy | Approximately -$53.2 million | Approximately +$31.3 million | Operating income or loss plus depreciation and amortization. This keeps the calculation focused on operating results before depreciation and amortization. |
| Pre-tax-derived EBITDA reconstruction | Approximately +$102.7 million | Approximately +$61.6 million | Pre-tax income plus interest expense and depreciation and amortization. This version can include non-operating income that sits above the pre-tax line. |
| Company-reported Adjusted EBITDA | +$528.8 million | +$132.8 million | Lyft’s non-GAAP measure, which makes additional exclusions for stock-based compensation, reserve changes, acquisition-related expenses, and other specified items. |
The operating-income-derived EBITDA proxy is calculated as operating income plus depreciation and amortization. For 2025, Lyft reported an operating loss of $188.4 million and depreciation and amortization of approximately $135.2 million, producing an EBITDA proxy of about negative $53.2 million.
The pre-tax-derived reconstruction starts from a different line. Lyft reported a 2025 pre-tax loss of $53.2 million, interest expense of approximately $20.8 million, and depreciation and amortization of approximately $135.2 million. That produces positive EBITDA of about $102.7 million because it also retains substantial non-operating income recorded above the pre-tax line.
Adjusted EBITDA moves further away from both calculations. Lyft reported $528.8 million of Adjusted EBITDA for 2025 after excluding items that included $322.3 million of stock-based compensation and $211.6 million related to changes in legal, tax, and regulatory reserves.
How to Read Provider-Derived EBITDA Figures
A provider-derived EBITDA figure can differ because providers may use different periods, classifications, data windows, or EBITDA definitions. Without the provider’s methodology, a specific difference cannot be reconciled precisely.
The figure should therefore be labeled as a provider-derived EBITDA estimate rather than presented as a number directly published by the company, unless the source clearly states otherwise.
The valuation consequence is important. EV/EBITDA is not economically useful when the selected EBITDA denominator is negative or close to zero. A small change in the denominator can produce an extreme multiple or change its sign. If Adjusted EBITDA is used instead, the investor should state that choice clearly and compare Lyft only with companies measured on a similar adjusted basis.
The correct question is therefore not simply, “What is Lyft’s EBITDA?” The correct question is, “Which EBITDA definition is being used, which expenses or income are included, and does that denominator represent repeatable operating earning power?”
Primary sources:
What Is a Good EV/EBITDA Ratio?
There is no universal good EV/EBITDA ratio. A reasonable multiple depends on the industry, peer group, leverage, cash balance, growth profile, margin durability, accounting quality, and capital intensity of the business being compared.
A lower multiple can look attractive only if EBITDA is durable, the balance sheet is manageable, and the business is not facing structural deterioration. A higher multiple can be reasonable if the company has stronger growth, more stable margins, better cash conversion, or lower business risk than peers.
Growth context should not replace the core EV/EBITDA analysis, but it can help explain why two companies with similar current EBITDA may trade differently. A separate growth-adjusted earnings lens can be useful when the main question is whether earnings growth changes the interpretation of an earnings multiple.
EV/EBITDA vs P/E
EV/EBITDA and P/E answer different valuation questions. EV/EBITDA compares the value of the whole business with an operating earnings proxy. P/E compares equity market value with earnings available to common shareholders.
Useful boundary: EV/EBITDA is more focused on enterprise value and operating earnings before financing effects. P/E is more focused on equity value and net income after interest, taxes, depreciation, amortization, and other below-operating-line items.
Neither ratio is automatically superior. EV/EBITDA may be more useful for capital-structure comparison, while P/E may be more useful when the focus is common-shareholder earnings. Both can mislead when used without business quality, accounting, balance-sheet, and peer context.
How to Read EV/EBITDA Without Turning It Into a Shortcut
A useful EV/EBITDA review starts with the formula, but it does not stop there. The analyst needs to ask whether enterprise value is measured consistently, whether EBITDA is recurring, whether the peer group is comparable, and whether the business requires heavy reinvestment to maintain earnings.
The ratio is strongest as a comparison tool, not as a standalone verdict. It can help identify valuation differences worth investigating, but the explanation usually comes from the assumptions behind the multiple rather than the number alone.
Interpretation rule: Treat EV/EBITDA as an assumption check. The multiple becomes more useful when enterprise-value inputs are clean, EBITDA is durable, capital intensity is understood, and peers are genuinely comparable.
FAQ
What does EV/EBITDA mean?
EV/EBITDA means enterprise value divided by EBITDA. It compares the value of the whole operating business with earnings before interest, taxes, depreciation, and amortization.
How do you calculate EV/EBITDA?
First calculate enterprise value, usually starting with market capitalization plus debt minus cash, with other claims added where relevant. Then divide enterprise value by EBITDA. For example, enterprise value of $4.0 billion divided by EBITDA of $500 million equals 8.0x.
What does EV/EBITDA tell investors?
EV/EBITDA can show how the market values operating earnings relative to enterprise value. It is most useful for peer comparison when companies have similar business models and comparable EBITDA quality.
Is a lower EV/EBITDA always better?
No. A lower EV/EBITDA multiple can reflect business risk, leverage, weak EBITDA quality, heavy capital expenditure, cyclical peak earnings, or poor peer comparability.
When is EV/EBITDA misleading?
EV/EBITDA can be misleading when EBITDA is negative, highly adjusted, cyclical, or not supported by durable operating economics. It can also mislead for capital-intensive or financial businesses where EBITDA does not capture the main economic drivers well.