
Price to book ratio compares the market value of a company’s common equity with its accounting book value. On a per-share basis, P/B is the share price divided by book value per common share.
The ratio becomes more informative when the book-value denominator is economically meaningful and the numerator and denominator refer to the same equity claim. Asset quality, profitability, required return, accounting treatment, and peer comparability all affect how the multiple should be read.
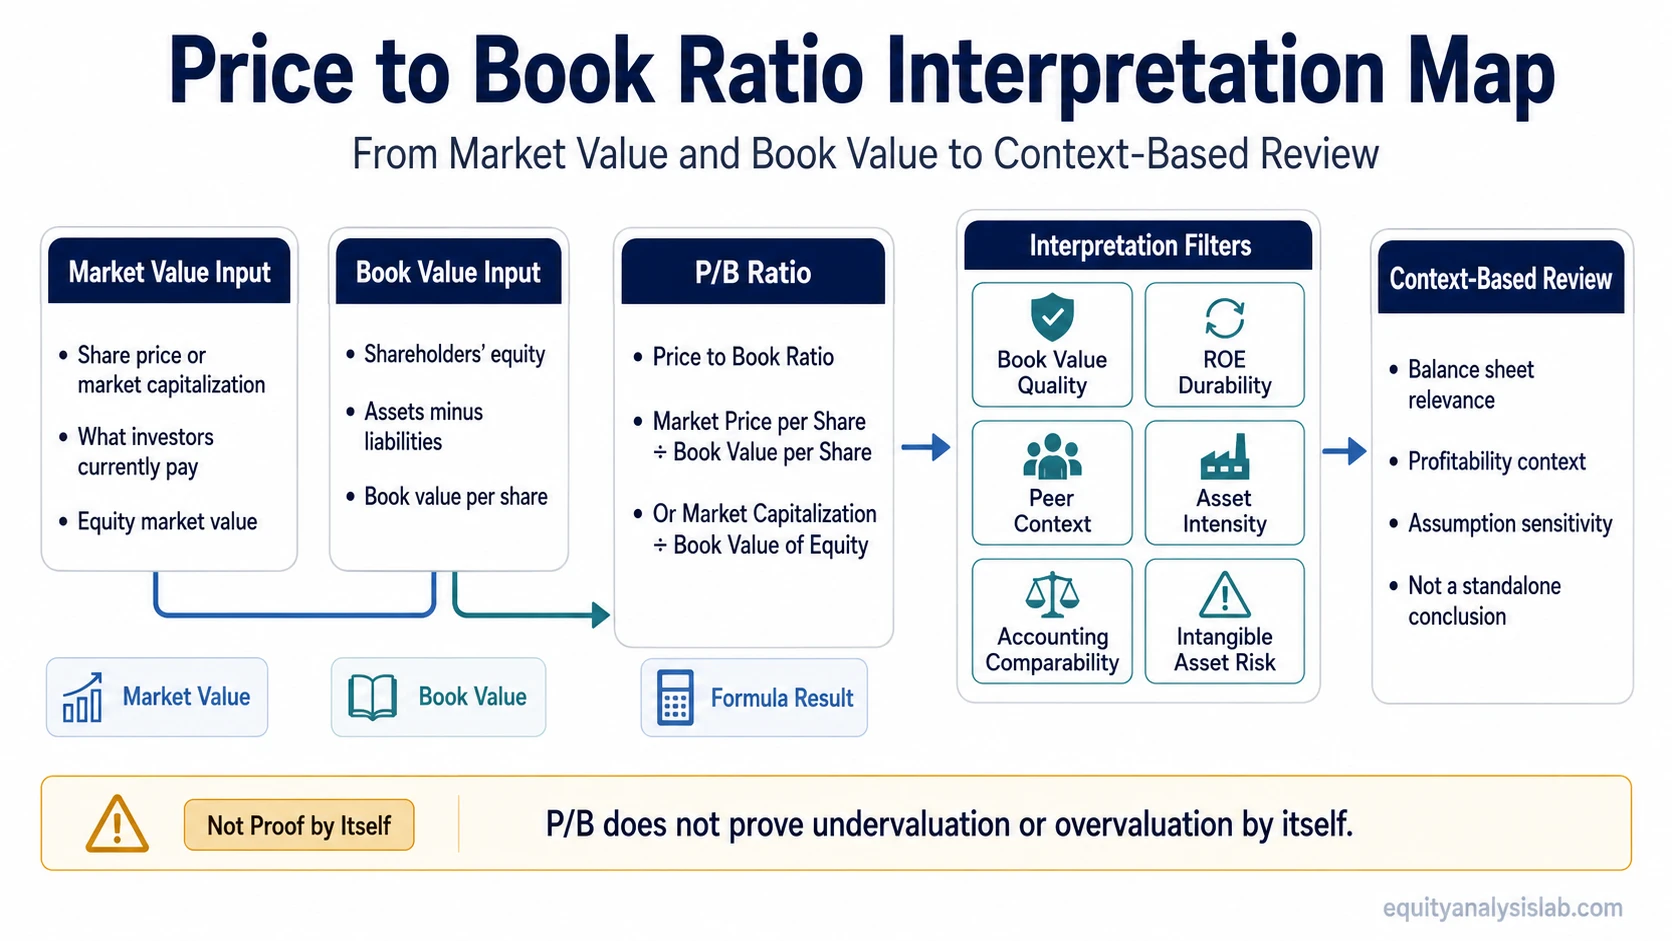
Price to Book Ratio Formula
The common per-share calculation is:
Price to Book Ratio = Market Price per Common Share ÷ Book Value per Common Share
The same relationship can be expressed at the company level:
Price to Book Ratio = Common Equity Market Value ÷ Common Book Value of Equity
| Input | Meaning | Analytical role |
|---|---|---|
| Market price per common share | The current market price assigned to one common share | Provides the market-value numerator for the per-share calculation |
| Book value per common share | Book value attributable to common shareholders divided by common shares outstanding | Provides the accounting-equity denominator per share |
| Common equity market value | The market value assigned to the outstanding common equity | Provides the company-level numerator |
| Common book value of equity | Accounting equity attributable to common shareholders | Provides the company-level denominator |
A common-stock market value should be compared with book value attributable to common shareholders. If the denominator contains equity claims that are not represented in the numerator, the resulting P/B is no longer a like-for-like comparison.
Accounting presentation and data-vendor methodology can differ, so the denominator should be checked before comparing P/B ratios across companies.
How to Interpret a Low or High Price to Book Ratio
P/B shows how the market values a company relative to its recorded common equity. The same multiple can carry different implications across industries and business models.
| P/B range | What the number shows | What requires further analysis |
|---|---|---|
| Below 1.0x | Market value is below recorded book equity | Asset quality, profitability, required return, impairment risk, and business outlook |
| Around 1.0x | Market value is close to recorded book equity | ROE, peer valuations, capital intensity, and the quality of the book-value denominator |
| Above 1.0x | Market value exceeds recorded book equity | ROE durability, growth expectations, intangible value, and the return required by investors |
There is no universal P/B level that defines a stock as cheap or expensive. A discount to book can reflect weak economics or questionable asset values. A premium can be supported by stronger profitability, growth, or economic assets that accounting book value does not fully represent.
Why ROE and Required Return Matter
Two companies can trade at the same P/B ratio while earning very different returns on their book equity. That difference changes the economics behind the multiple.
Valuation frameworks connect price-to-book ratios with return on equity, expected growth, payout, and the return investors require. The relationship is especially relevant for banks, where book equity is central to the capital structure and P/B is commonly evaluated alongside ROE and cost of equity.
A higher P/B can therefore be more defensible when a company earns durable returns on equity above the return required for that risk. Weak or unstable returns can justify a lower multiple even when the accounting book value looks substantial.
Simple Price to Book Ratio Example
Example: A hypothetical company has $500 million in assets and $300 million in liabilities. Assume the resulting $200 million of equity is attributable to common shareholders and the company has 20 million common shares outstanding. Book value per share is $10. If the stock trades at $15, the P/B ratio is 1.5x.
The market is valuing the common equity at 1.5 times its recorded book value. Whether that premium is reasonable depends on the returns generated from the equity base, the quality of the assets, expected growth, required return, and comparable companies.
Book Value and Tangible Book Value
The denominator deserves separate attention because accounting book value can contain recognized intangible assets while excluding some internally generated economic value.
Uses accounting equity attributable to shareholders and can include recognized goodwill or other intangible assets depending on the company’s balance sheet.
Tangible book value narrows the equity base by excluding goodwill and other intangible assets under the selected definition.
Under IFRS IAS 38, internally generated brands, customer lists, and similar items are not recognized as intangible assets, while qualifying development expenditure can be recognized. P/B can therefore miss some internally created economic value without literally excluding every intangible asset from book equity.
When Price to Book Ratio Is Most Useful
P/B works best when accounting equity has a meaningful relationship with the capital required to operate the business and when the companies being compared have reasonably similar economics.
| Condition | P/B is more informative when | P/B becomes weaker when |
|---|---|---|
| Book equity | Common book equity is positive and economically meaningful | Book equity is negative, close to zero, or heavily distorted |
| Business model | The balance sheet is central to the economics of the business | Internally generated intangible value drives much of the business economics |
| Peer comparison | Companies use reasonably comparable accounting and have similar capital structures | Accounting treatment, leverage, or business models differ materially |
| Profitability | ROE can be evaluated on a reasonably stable equity base | Restructuring, large write-offs, acquisitions, or major capital changes make the equity base difficult to compare |
Limits of Price to Book Ratio
A P/B ratio below 1.0x shows that market value is below recorded book equity under the selected inputs. It does not establish that the assets could be sold at their carrying values or that common shareholders would receive book value in a liquidation.
P/B also becomes difficult to interpret when common book equity is negative or very close to zero. The denominator can make the ratio negative, unusually large, or economically unhelpful even when the arithmetic itself is correct.
Buybacks, acquisitions, impairments, accumulated losses, and other accounting changes can alter book equity without producing a matching change in the underlying operating business. Those effects should be understood before a change in P/B is treated as a change in valuation.
How to Use P/B in Company Analysis
Check that the market-value numerator and book-value denominator refer to the same common-equity claim.
Review asset quality, goodwill and intangibles, impairments, acquisitions, buybacks, and any other items that materially affect reported equity.
Read P/B alongside return on equity, expected growth, and the return required for the company’s risk.
Use peers with similar business models, accounting treatment, capital intensity, and profitability before treating a relative P/B difference as meaningful.
Price to Book Ratio vs Other Valuation Multiples
A price-to-earnings multiple relates market value to earnings rather than accounting book equity.
The PEG ratio relates an earnings multiple to an EPS growth assumption.
A revenue-based multiple shifts the denominator to sales, which makes margins and eventual profitability central to interpretation.