Price to sales ratio can look like a shortcut for deciding whether a stock is cheap or expensive, but the ratio only compares market value with revenue. It does not show profit quality, cash conversion, debt risk, or whether revenue can become durable earnings.
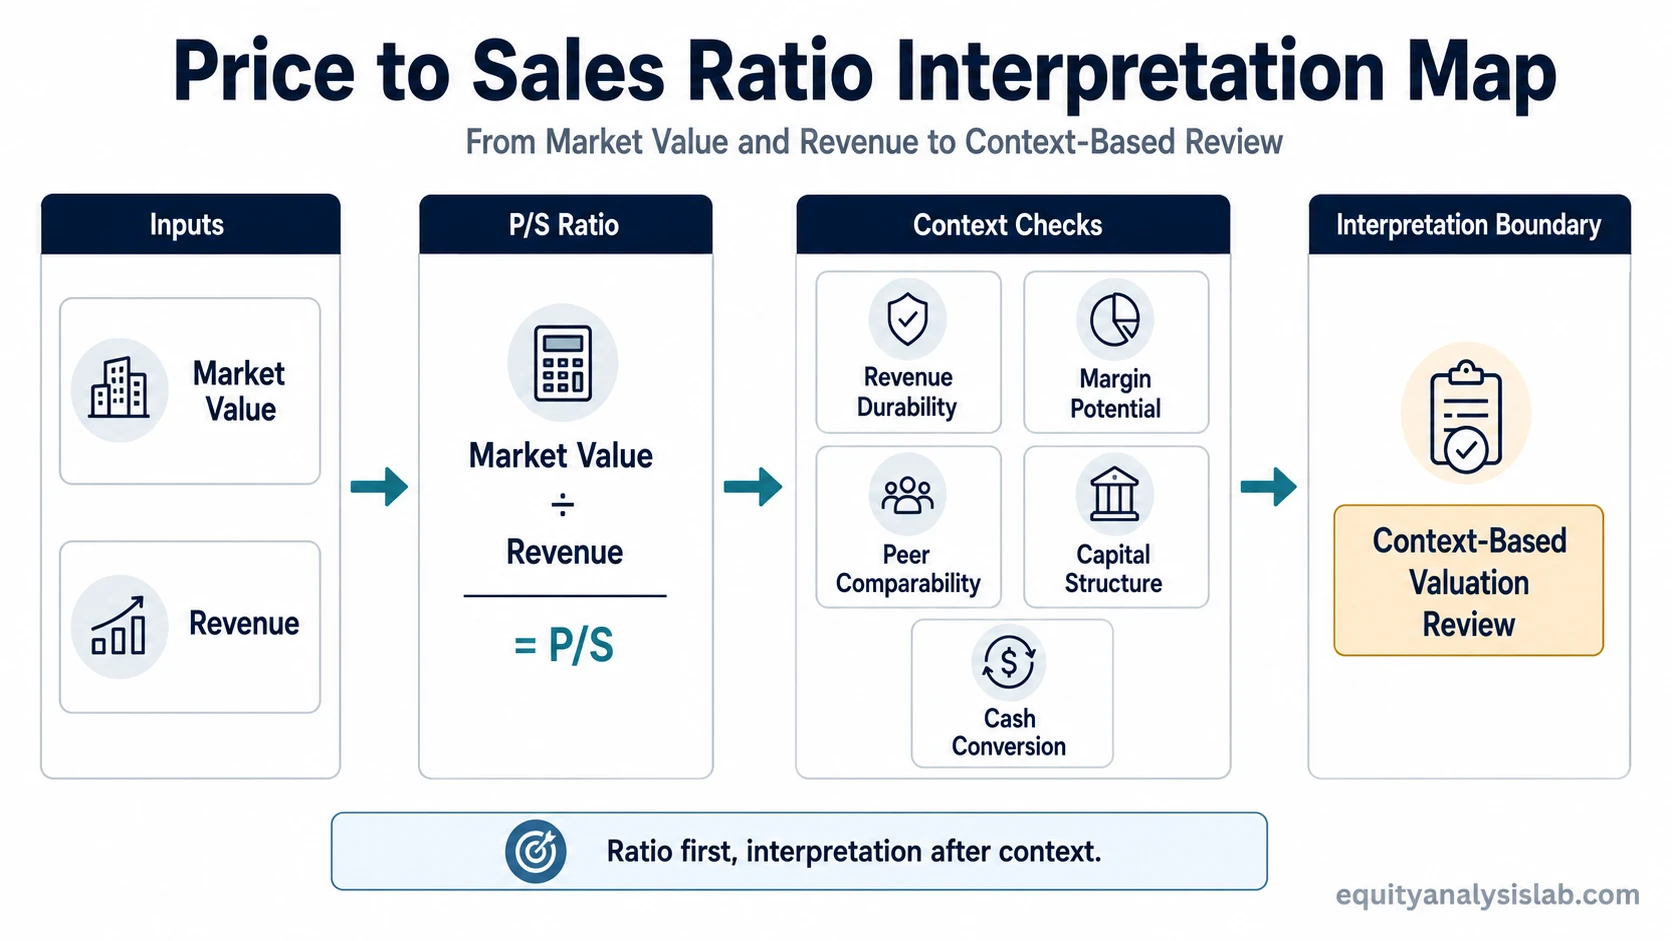
Price to sales ratio, often written as P/S ratio, measures a company’s market value relative to its revenue. The basic formula is market capitalization divided by revenue, or share price divided by sales per share.
Key Points
- P/S compares what the equity market is paying for each dollar of company revenue.
- The ratio can be calculated with market capitalization and total revenue, or with share price and sales per share.
- A lower P/S ratio does not automatically prove undervaluation, and a higher P/S ratio does not automatically prove overvaluation.
- Interpretation depends on revenue durability, margins, peer comparability, capital intensity, dilution risk, and balance-sheet context.
What Price to Sales Ratio Measures
Price to sales ratio measures market value against sales. If a company has a P/S ratio of 3, the equity market is valuing the company at about three dollars for every one dollar of revenue. That comparison can be useful when earnings are negative, temporarily depressed, or difficult to compare, but it still remains a revenue-based measure rather than a profit-based measure.
The numerator is usually equity market value. The denominator is revenue over a chosen period, often trailing twelve months, the most recent fiscal year, or a forward revenue estimate. Changing the revenue period can change the ratio, especially for companies with fast growth, cyclical sales, acquisitions, or revenue declines.
Price to Sales Ratio Formula
Price to sales ratio = Market capitalization / Revenue
Price to sales ratio = Share price / Sales per share
The first version uses total equity market value and total company revenue. The second version uses per-share inputs. Both formulas express the same idea when the share count and revenue figures are measured consistently.
Sales and revenue are usually used interchangeably in this ratio. The key is consistency. A trailing market capitalization should not be casually compared with a forward revenue estimate without recognizing that the result now depends on a forecast, not only on reported numbers.
How to Calculate Price to Sales Ratio
Assume a company has a market capitalization of $6 billion and generated $2 billion of revenue over the last twelve months. Its price to sales ratio would be:
$6 billion / $2 billion = 3.0x P/S
That means the equity market is pricing the company at three times its trailing revenue. The calculation is simple, but the interpretation is not. A 3.0x P/S ratio may look expensive for a low-margin, cyclical business and more reasonable for a company with recurring revenue, high gross margins, and a credible path to cash flow.
The P/S Assumption Stack
The same P/S ratio can describe very different businesses. The useful question is not only “what is the ratio?” but also “what assumptions make that ratio meaningful?”
| Input or assumption | What it captures | Why it can change interpretation |
|---|---|---|
| Market capitalization or share price | Equity market value | Debt and cash sit outside P/S, so capital structure can distort peer comparisons. |
| Revenue or sales per share | Sales base in the denominator | Revenue growth can look strong while margins, dilution, or cash conversion remain weak. |
| Revenue period | TTM, annual, or forward sales | Forward revenue adds forecast risk; trailing revenue may lag an inflection or slowdown. |
| Revenue durability | Recurring, cyclical, or one-time sales | Durable recurring revenue is not the same as temporary or highly cyclical revenue. |
| Margin potential | Ability to turn sales into profit | Revenue is less valuable if it cannot convert into margin and earnings over time. |
| Peer comparability | Sector, model, growth, and capital intensity | P/S works best among similar companies, not unrelated industries. |
| Debt, cash, and capital structure | Balance-sheet context | P/S can miss leverage or excess cash because it is usually based on equity value. |
| Cash conversion and reinvestment need | Revenue after costs and reinvestment | A business can grow sales while still consuming cash or requiring heavy reinvestment. |
How Investors Interpret P/S
Investors usually interpret P/S by comparing companies with similar business models, revenue quality, margin structures, and growth profiles. The ratio is weaker when it is used across unrelated industries because revenue economics differ sharply between software, retail, manufacturing, financials, and commodity-linked businesses.
A lower P/S ratio can mean the market is paying less for each dollar of sales. It can also reflect low margins, weak growth, dilution risk, poor cash conversion, high leverage, or declining business quality. A higher P/S ratio can reflect strong expected growth, recurring revenue, high margin potential, or excessive optimism. The ratio itself does not decide which interpretation is correct.
The most useful reading connects revenue to future economics. Sales become more meaningful when they can support durable margins, earnings quality, and free cash flow over time. Without that connection, P/S may describe size more than value.
Why Price to Sales Ratio Can Mislead
P/S can mislead when revenue is treated as value by itself. Revenue is only the top line. It does not show whether the company is profitable, whether profits are durable, how much capital the business needs, or whether shareholders are being diluted.
A low P/S ratio may look attractive, but it can be a warning sign if sales are shrinking, margins are structurally poor, or the company needs large reinvestment just to maintain revenue. A high P/S ratio may look stretched, but it may be more understandable when the company has durable revenue, strong pricing power, and a credible path to margin expansion.
P/S also has a capital-structure limitation. Because the numerator is usually equity market value, two companies with similar revenue can show similar P/S ratios while carrying very different levels of debt or cash. That is why EV/Sales is often used when capital structure needs to be included more directly.
Price to Sales Ratio vs Related Valuation Ratios
P/S is one valuation multiple, not a complete valuation framework. It is often compared with earnings, book value, and growth-adjusted ratios because each ratio answers a different question.
| Ratio | Main input | Useful boundary |
|---|---|---|
| P/S ratio | Revenue | Useful for revenue-based comparison, but weak on profitability and capital structure. |
| Earnings-based multiple | Earnings | More directly tied to profitability, but less useful when earnings are negative or distorted. |
| Price-to-book ratio | Book value | More asset-value oriented, but weaker for companies where intangible assets dominate. |
| PEG ratio | Earnings multiple and growth | Adds a growth adjustment to an earnings multiple, but depends heavily on growth assumptions. |
| EV/Sales | Enterprise value and revenue | Better reflects debt and cash than a standard equity-value P/S ratio. |
Investor-Use Boundary
Price to sales ratio is best used as a starting comparison tool. It can help investors notice how the market values a company’s revenue base, especially when earnings are temporarily negative or not yet stable. It should not be used alone to decide whether a stock is undervalued, overvalued, or suitable for purchase.
A stronger review asks whether revenue is durable, whether margins can improve, whether cash flow can support the valuation, whether the balance sheet changes the risk, and whether the peer group is truly comparable. The ratio becomes more useful when it is part of a broader valuation and business-quality review.
FAQ
What is price to sales ratio?
Price to sales ratio measures a company’s market value relative to its revenue. It is commonly calculated as market capitalization divided by revenue, or share price divided by sales per share.
Is a low price to sales ratio good?
A low P/S ratio can mean the market is paying less for each dollar of revenue, but it does not automatically mean the stock is cheap. Low margins, weak growth, debt, dilution, or poor cash conversion can all make a low ratio less attractive.
When is P/S useful?
P/S can be useful when earnings are negative, volatile, or temporarily distorted. It is most useful when comparing similar companies with similar revenue models, margin potential, growth profiles, and capital intensity.
What does P/S ignore?
P/S does not directly show profitability, cash flow, debt, cash, capital intensity, or earnings quality. It measures revenue against equity market value, so it needs additional context before interpretation.