The price-to-earnings ratio compares a company’s share price with its earnings per share. It is a valuation multiple that shows how much the market is paying for one unit of reported or expected earnings.
A P/E ratio is not a standalone verdict on value. The same number can mean different things depending on the earnings base, the quality of those earnings, expected growth, business cyclicality, and whether the company is being compared with similar peers.
What Is the Price-to-Earnings Ratio?
The price-to-earnings ratio, often written as P/E ratio or PE ratio, measures the relationship between a company’s market price and its earnings per share. If a stock trades at 20 times earnings, the market price is 20 times the earnings per share used in the calculation.
The ratio is most useful as a comparison tool. It helps frame how the market values a company’s earnings relative to its own history, similar companies, growth expectations, and earnings quality. A low P/E does not automatically mean undervaluation, and a high P/E does not automatically mean overvaluation.
Price-to-Earnings Ratio Formula
The basic P/E formula divides share price by earnings per share.
| Formula element | Meaning | Interpretation risk |
|---|---|---|
| P/E ratio | Share price divided by earnings per share | The result changes when either price or EPS changes |
| Share price | The market price of one share | Price can reflect expectations, risk, sentiment, and liquidity |
| Earnings per share | Net income allocated to each share | EPS can be affected by one-time items, accounting choices, buybacks, dilution, or cyclical margins |
Basic formula: P/E ratio = share price / earnings per share.
For example, if a company trades at $50 per share and earns $5 per share, its P/E ratio is 10. If the same share price is divided by $2.50 of EPS instead, the P/E ratio becomes 20. The price did not change, but the earnings denominator changed the valuation multiple.
What the P/E Ratio Shows Investors
The P/E ratio shows the price being paid for a company’s earnings. A higher P/E can reflect stronger expected growth, higher perceived business quality, more durable earnings, or simply an expensive market price. A lower P/E can reflect a cheaper valuation, slower growth, weaker earnings quality, cyclical risk, balance-sheet concern, or market skepticism.
The ratio becomes more useful when the question changes from “is the P/E high or low?” to “what assumptions make this P/E reasonable or risky?” That shift keeps the multiple tied to earnings durability instead of treating the number as a verdict.
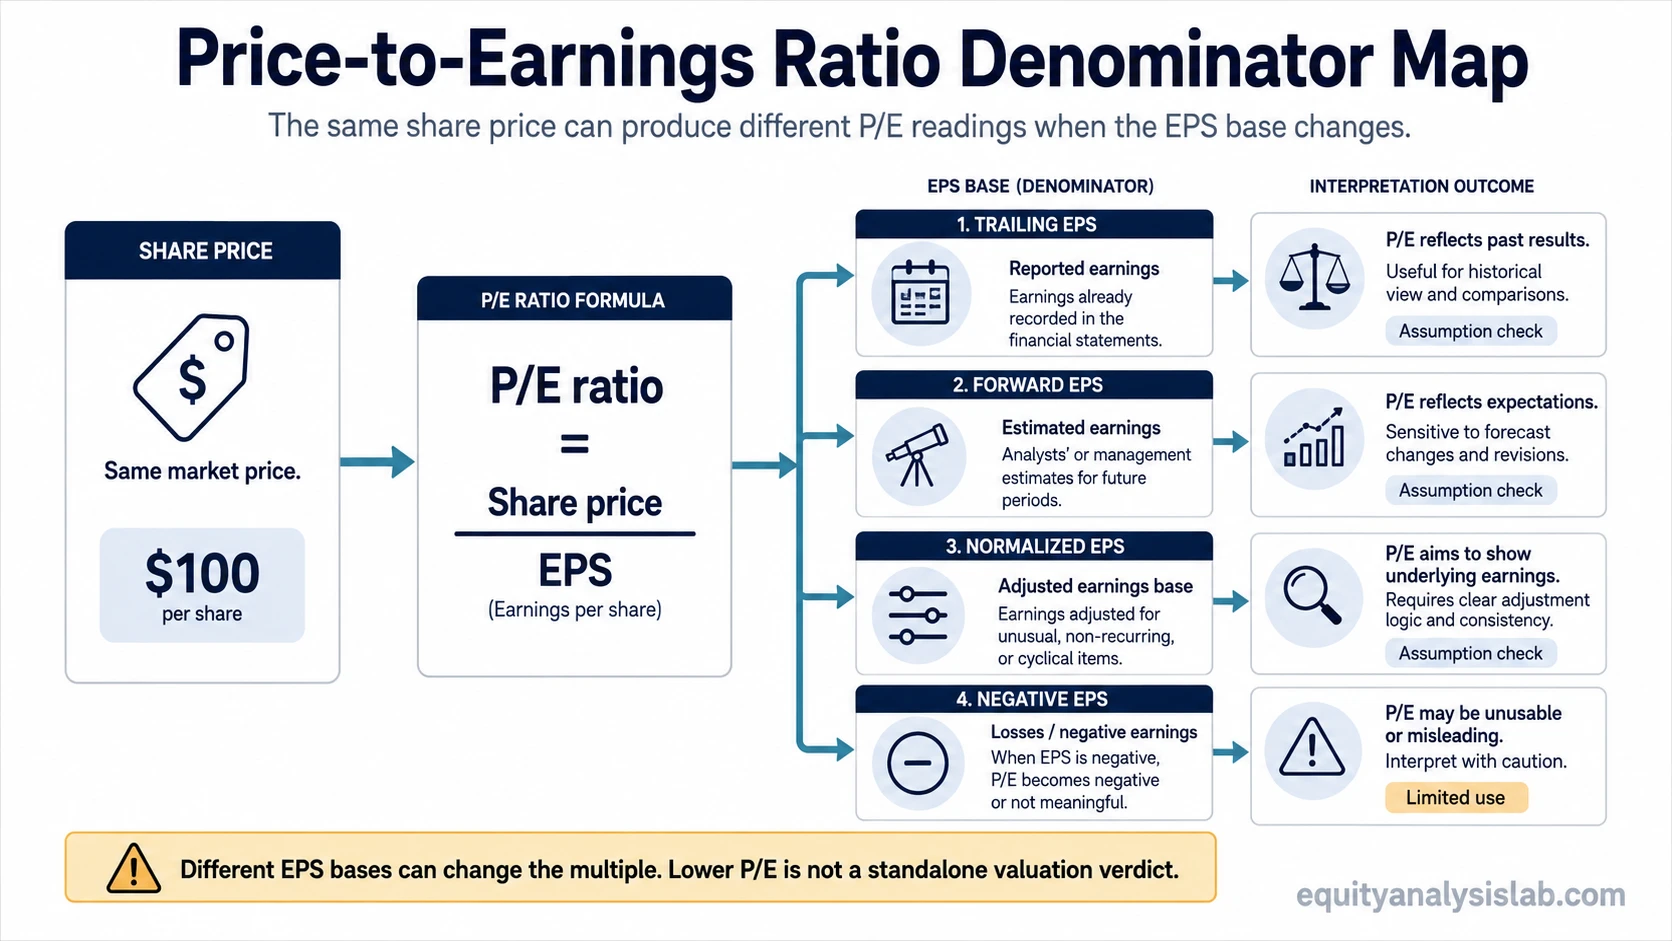
Why the EPS Denominator Changes the Meaning
The earnings denominator controls much of the P/E interpretation. EPS can represent trailing reported earnings, forward estimated earnings, normalized earnings, adjusted earnings, or a temporarily distorted earnings base. Each version can produce a different multiple for the same share price.
A trailing P/E uses earnings already reported. A forward P/E uses expected future earnings. Forward earnings can be useful when current earnings are temporarily depressed or unusually elevated, but the estimate can be wrong. A lower forward P/E is only as reliable as the future EPS assumption behind it.
Earnings quality also matters. EPS is stronger when it is supported by durable revenue, recurring margins, cash flow, and a stable share count. If EPS improves mainly because of a one-time gain, aggressive adjustments, temporary cost cuts, or share reduction without business improvement, the P/E ratio may look cleaner than the business reality.
P/E Ratio Sensitivity to Earnings Assumptions
The same stock price can create different P/E ratios when the earnings base changes. A sensitivity view helps separate the formula from the interpretation.
| Hypothetical share price | EPS used | Resulting P/E | Possible interpretation issue |
|---|---|---|---|
| $60 | $6.00 recurring EPS | 10.0x | The multiple may look low, but peer quality, growth, and risk still matter |
| $60 | $4.00 normalized EPS | 15.0x | Normalizing earnings can make the same price look less cheap |
| $60 | $3.00 forward EPS estimate | 20.0x | A weaker future EPS assumption raises the multiple even if price is unchanged |
| $60 | Negative EPS | Not meaningful | A negative denominator can make the P/E ratio unusable or misleading |
This is why the P/E ratio is an assumption-sensitive tool. The multiple depends not only on the share price, but also on which earnings number is treated as the denominator.
Example: Same Price, Different Earnings Base
Consider a hypothetical company trading at $80 per share. If trailing EPS is $8, the trailing P/E is 10. If analysts expect next-year EPS of $5, the forward P/E is 16. If normalized EPS after removing a one-time gain is $4, the normalized P/E is 20.
The stock price is the same in all three cases. The difference comes from the earnings base. A 10x P/E may look inexpensive, but if that number depends on temporarily elevated earnings, the apparent cheapness can disappear when the denominator is adjusted.
Limitations of the P/E Ratio
Low P/E does not automatically mean cheap. A low multiple can reflect weak growth, declining margins, cyclical peak earnings, legal risk, balance-sheet pressure, or market concern about future earnings durability.
High P/E does not automatically mean expensive. A high multiple can reflect high expected growth, durable competitive advantages, unusually strong margins, or low near-term earnings that the market expects to recover. The assumption may still be wrong, but the number alone is not enough.
Negative or very low EPS can break the ratio. When EPS is negative, near zero, or temporarily distorted, the P/E ratio can become unusable. Other valuation methods may be needed when earnings do not represent the business properly.
Peer comparison can be misleading. P/E ratios are more useful when companies have similar business models, accounting profiles, margin structure, capital intensity, growth outlook, and cyclicality. Comparing a mature cyclical business with a high-growth software company can create a false valuation signal.
How to Compare P/E Ratios Responsibly
A responsible P/E comparison starts with the earnings base. The analysis should identify whether the multiple uses trailing EPS, forward EPS, adjusted EPS, or normalized EPS. Mixing these inputs can make one company look cheaper or more expensive for reasons that come from the calculation rather than the business.
The next step is peer quality. Companies with different growth rates, balance sheets, margins, reinvestment needs, and earnings durability may deserve different multiples. The P/E ratio is strongest when it compares similar earnings streams, not just similar ticker labels.
Growth expectations can also change the reading. When growth is the main difference between two companies, the PEG ratio adds a growth-adjusted lens, though it also depends heavily on the growth assumption used in the denominator.
Related Valuation Multiples
P/E focuses on earnings per share. That makes it different from multiples that use other valuation bases. The price-to-book ratio compares market value with book value instead of EPS, which can be more relevant for some asset-heavy or financial businesses.
Other valuation multiples may use revenue, free cash flow, EBITDA, EBIT, or growth-adjusted earnings. The useful question is not which multiple is always best, but which denominator best represents the economic reality of the company being analyzed.
FAQ
What is a good price-to-earnings ratio?
There is no universal good P/E ratio. A useful reading depends on the company’s earnings quality, growth outlook, balance sheet, industry, cyclicality, and peer group.
Is a low P/E ratio always better?
No. A low P/E ratio can reflect possible undervaluation, but it can also reflect weak growth, temporary peak earnings, business risk, or declining earnings expectations.
Why can trailing P/E and forward P/E be different?
Trailing P/E uses reported past earnings, while forward P/E uses expected future earnings. If future EPS estimates differ from reported EPS, the two multiples can show different valuation readings for the same company.
Can the P/E ratio be used when earnings are negative?
Negative earnings usually make the P/E ratio unusable or misleading because the denominator no longer represents positive earnings power. Other valuation methods may be needed.