The PEG ratio is a valuation multiple that compares a company’s price-to-earnings ratio with its earnings growth rate.
Definition: PEG ratio means price/earnings-to-growth ratio. It is calculated by dividing a company’s P/E ratio by an EPS growth rate, usually expressed as a percentage input.
A PEG ratio tries to adjust a price-to-earnings ratio for growth. The result can look more useful than P/E alone, but it depends heavily on the growth number used in the denominator.
A PEG ratio is only as useful as the growth assumption behind it. A low result can come from a reasonable growth outlook, but it can also come from an aggressive estimate, a temporary earnings rebound, or an EPS base that does not match the growth input.
Key Points
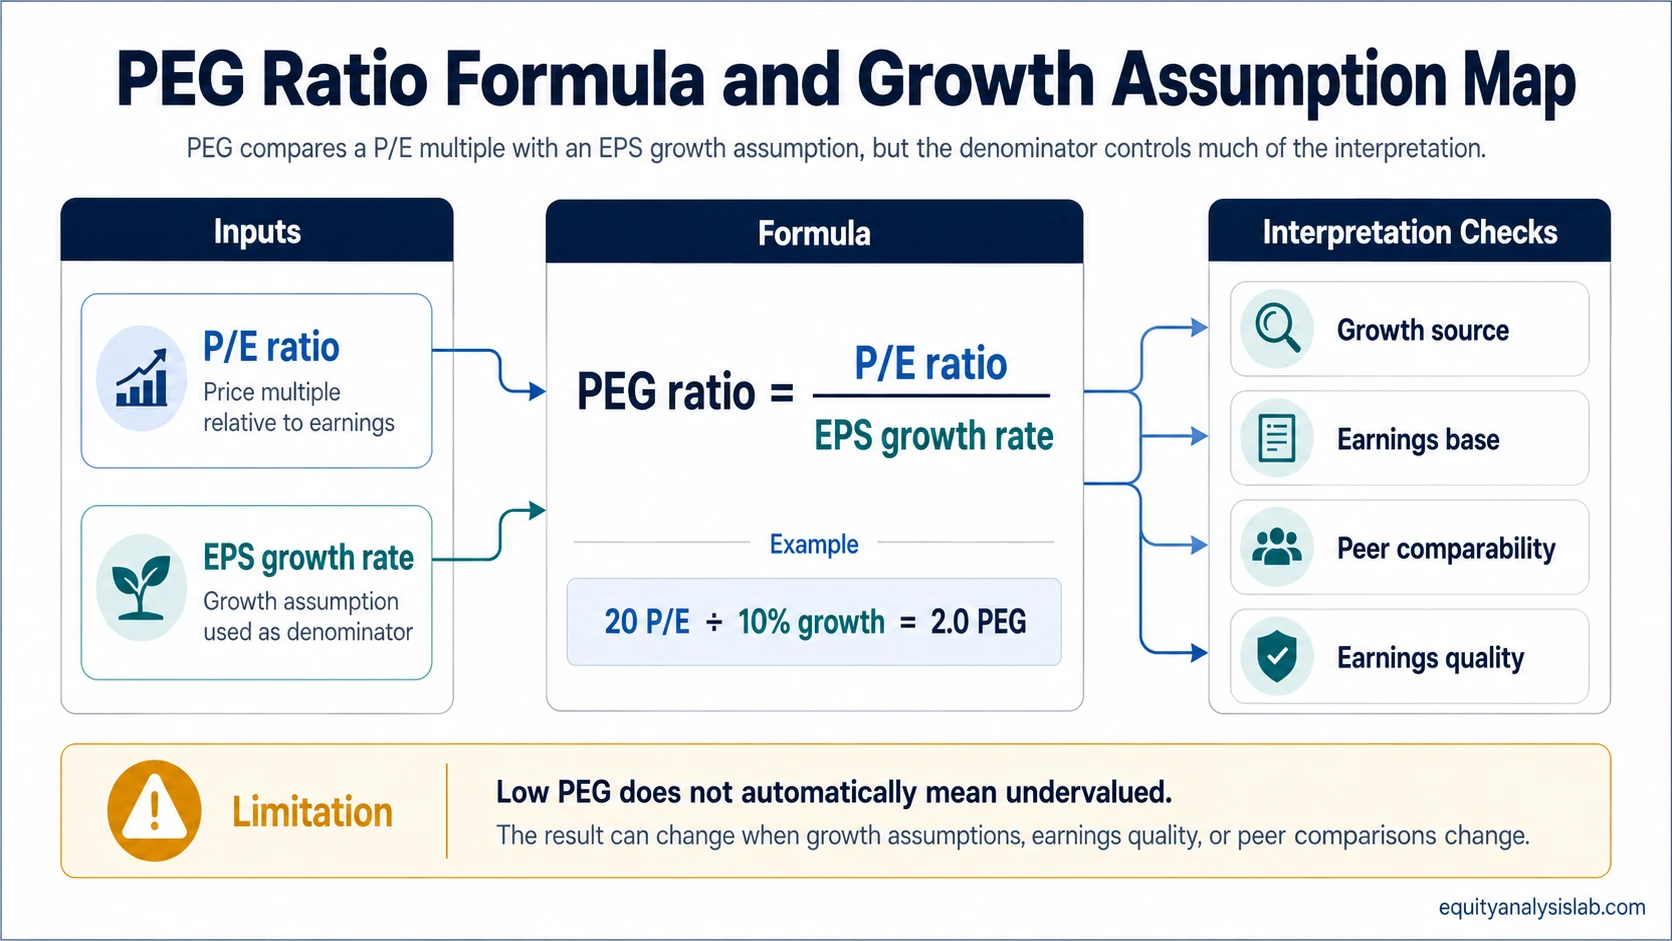
- PEG ratio compares a company’s P/E multiple with an EPS growth rate.
- The basic formula is P/E ratio divided by EPS growth rate.
- The growth denominator may be historical, forward-looking, one-year, multi-year, analyst-based, or company-guided.
- A lower PEG ratio does not automatically prove undervaluation.
- PEG works best when earnings are positive, growth is reasonably durable, and the peer group is comparable.
What PEG Ratio Means
PEG ratio links a valuation multiple to an earnings growth assumption. A company with a high P/E ratio may look less expensive on PEG if earnings are expected to grow quickly. A company with a low P/E ratio may look less attractive on PEG if earnings growth is weak or unstable.
The ratio is still a comparison tool, not a valuation verdict. It does not measure business quality by itself, and it does not show whether the growth rate is realistic, durable, cash-flow supported, or already reflected in the share price.
The useful question is not only what the PEG ratio is. The useful question is which growth assumption is being used, and whether that assumption matches the earnings base, company quality, and peer group.
PEG Ratio Formula
The standard PEG ratio formula is:
PEG ratio = P/E ratio ÷ EPS growth rate
If a company has a P/E ratio of 20 and an expected EPS growth rate of 10%, the PEG ratio is 2.0. The growth rate is usually entered as 10, not 0.10, in the common valuation convention.
| Input | Example value | Role in the formula |
|---|---|---|
| P/E ratio | 20 | Shows the price multiple relative to earnings. |
| EPS growth rate | 10% | Acts as the growth denominator used to scale the P/E ratio. |
| PEG ratio | 2.0 | Shows the P/E multiple relative to the chosen growth assumption. |
The formula looks simple, but the quality of the answer depends on the consistency of the inputs. A precise calculation can still create a weak valuation signal if the growth denominator is poorly chosen.
What the Growth Denominator Changes
The denominator is the main assumption in the PEG ratio. The same P/E ratio can produce different PEG ratios when the EPS growth input changes.
That growth rate may come from past EPS growth, analyst estimates, company guidance, a multi-year forecast, or an investor’s own model. Each source answers a different valuation question.
| Denominator choice | What it measures | Main risk |
|---|---|---|
| Historical EPS growth | How earnings grew over a previous period. | Past growth may not continue, especially after a cycle peak or one-off recovery. |
| Forward EPS growth estimate | How earnings are expected to grow in a future period. | Estimates can be too optimistic or too short-term. |
| One-year growth rate | Expected growth over the next year. | A single year can be distorted by rebounds, cost cuts, or temporary margins. |
| Multi-year growth rate | Expected growth across several years. | Longer forecasts can depend on many assumptions that are difficult to verify. |
| Analyst consensus growth | The market’s aggregated estimate set. | Consensus may lag changing business conditions or embed optimistic assumptions. |
| Investor-modeled growth | A custom estimate based on the investor’s assumptions. | The result is only as strong as the model’s revenue, margin, share-count, and reinvestment assumptions. |
Before using PEG, check:
- Which P/E base is being used.
- Which EPS growth period is being used.
- Whether the growth source is historical, forward, consensus-based, or model-based.
- Whether EPS growth reflects business growth, buybacks, dilution, or accounting effects.
- Whether the peer group is comparable enough for the PEG result to matter.
Consistency matters. If the P/E ratio is based on forward earnings, the growth rate should normally relate to the same forward earnings base. If the P/E ratio uses trailing earnings but the denominator uses an optimistic forward growth estimate, the PEG ratio may look cleaner than the underlying assumptions deserve.
How Investors Interpret PEG Ratio
Investors often use PEG ratio to ask whether a P/E multiple looks high or low relative to expected growth. A lower PEG ratio can make a stock look cheaper relative to growth, while a higher PEG ratio can make the same stock look more expensive relative to growth.
That interpretation is conditional. A company can deserve a higher PEG ratio if its growth is more durable, margins are stronger, reinvestment opportunities are better, or earnings quality is higher. A company can deserve a lower PEG ratio if its growth is cyclical, capital-intensive, diluted by share issuance, or dependent on temporary earnings conditions.
Peer comparability also matters. PEG is more useful when companies have similar business models, accounting quality, profitability profiles, capital intensity, and growth durability. Comparing a stable software company, a cyclical commodity producer, and a bank through one PEG threshold can create a false sense of precision.
Why Low PEG Does Not Prove Undervaluation
Limitation: A low PEG ratio does not prove that a stock is undervalued. It may simply reflect a growth estimate that is too high, a temporary earnings rebound, low earnings quality, sector mismatch, or a P/E ratio based on an earnings number that is not durable.
The most common mistake is treating the denominator as if it were a fact. Forward growth is an assumption. Historical growth is a record of what already happened. Neither automatically shows what the business can earn over a full cycle.
A low PEG ratio can be misleading when earnings are recovering from a depressed base. It can also be misleading when margins are temporarily elevated, when buybacks flatter EPS growth, when dilution offsets business growth, or when reported earnings differ from cash earnings.
That is why PEG should be read alongside quality of earnings, balance-sheet risk, cash flow, business durability, and peer comparability. The ratio can help frame a valuation question, but it cannot answer the whole question alone.
Forward PEG vs Trailing PEG
Forward PEG uses expected future EPS growth in the denominator. Trailing PEG uses historical EPS growth. The two versions can produce different results because they answer different questions.
| Version | Growth input | Main interpretation risk |
|---|---|---|
| Forward PEG | Expected EPS growth. | Depends on forecast quality and the reasonableness of the estimate. |
| Trailing PEG | Historical EPS growth. | Can be distorted by past conditions that may not repeat. |
The distinction is similar to the difference between forward and trailing P/E. A fuller treatment of that input difference belongs in forward P/E vs trailing P/E.
PEG Ratio Example
Use a simple illustrative example. This is not a real company and does not imply that either result is attractive or unattractive.
Example: A company has a P/E ratio of 20. If expected EPS growth is 10%, the PEG ratio is 2.0. If another analyst assumes 20% growth, the PEG ratio becomes 1.0.
| Scenario | P/E ratio | EPS growth assumption | PEG ratio |
|---|---|---|---|
| Lower growth assumption | 20 | 10% | 2.0 |
| Higher growth assumption | 20 | 20% | 1.0 |
The company did not become cheaper in the second scenario. The ratio changed because the growth denominator changed. That is the central interpretation risk in PEG analysis.
Where PEG Works Best and Where It Weakens
PEG works best when earnings are positive, growth is reasonably stable, and the companies being compared have similar economics. It weakens when earnings are volatile, negative, temporarily depressed, or heavily adjusted.
| Condition | PEG is more useful when | PEG is weaker when |
|---|---|---|
| Earnings base | Earnings are positive and recurring. | Earnings are negative, temporarily depressed, or inflated by one-off items. |
| Growth durability | Growth has a credible multi-year business basis. | Growth depends on a short rebound, cost cuts, or cyclical recovery. |
| Peer group | Companies have similar business models and accounting profiles. | Companies differ widely by sector, margin structure, leverage, or capital intensity. |
| Earnings quality | Reported EPS is supported by cash flow and recurring operations. | EPS growth is helped by accounting items, temporary margins, or aggressive adjustments. |
| Share count | EPS growth reflects real business growth. | EPS growth is heavily affected by buybacks or diluted by share issuance. |
Growth is useful in valuation only when its durability, quality, and cost are understood.
Related Valuation Concepts
PEG is closely tied to P/E because it starts with the P/E multiple and then adjusts that multiple for growth. A direct comparison between the two concepts appears in P/E ratio vs PEG ratio.
For broader context, valuation multiples compare different measures of price, enterprise value, earnings, sales, book value, or cash flow. PEG is one member of that family, and it is most useful when the growth input is handled carefully.
PEG also depends on the quality and durability of EPS growth. A growth rate that looks attractive on paper can lose meaning if it is not supported by recurring earnings, cash generation, or a defensible business model.
FAQ
What is the PEG ratio?
The PEG ratio is the price/earnings-to-growth ratio. It compares a company’s P/E ratio with an EPS growth rate to show how the valuation multiple relates to the chosen growth assumption.
How is PEG ratio calculated?
PEG ratio is calculated by dividing the P/E ratio by the EPS growth rate. For example, a P/E ratio of 20 divided by a 10% growth rate gives a PEG ratio of 2.0 under the common percentage-input convention.
Is a low PEG ratio always good?
No. A low PEG ratio can be misleading if the growth estimate is too optimistic, the earnings base is temporary, earnings quality is weak, or the company is being compared with the wrong peer group.
What is the difference between forward PEG and trailing PEG?
Forward PEG uses expected future EPS growth, while trailing PEG uses historical EPS growth. Forward PEG depends on estimate quality, while trailing PEG can be distorted by past conditions that may not repeat.