
Margin of safety is the gap between an estimated intrinsic value and the current market price, usually expressed as a percentage of estimated intrinsic value. It is used as a buffer against valuation error, not as proof of true value, a guaranteed floor, a price target, or an investment recommendation.
Definition: In investing, margin of safety measures how far market price sits below an estimated valuation benchmark. The concept depends on the quality of the intrinsic value estimate because the buffer is calculated against an estimate rather than an observable fact.
Key Points About Margin of Safety
- Margin of safety compares estimated intrinsic value with market price.
- The common percentage formula divides the valuation gap by estimated intrinsic value.
- The same gap can also be expressed in dollars.
- The formula can be reversed to calculate the reference price corresponding to a selected target margin.
- The output remains dependent on the underlying valuation estimate.
- Investing margin of safety is different from accounting margin of safety.
Margin of Safety Formula
The standard investing formula is:
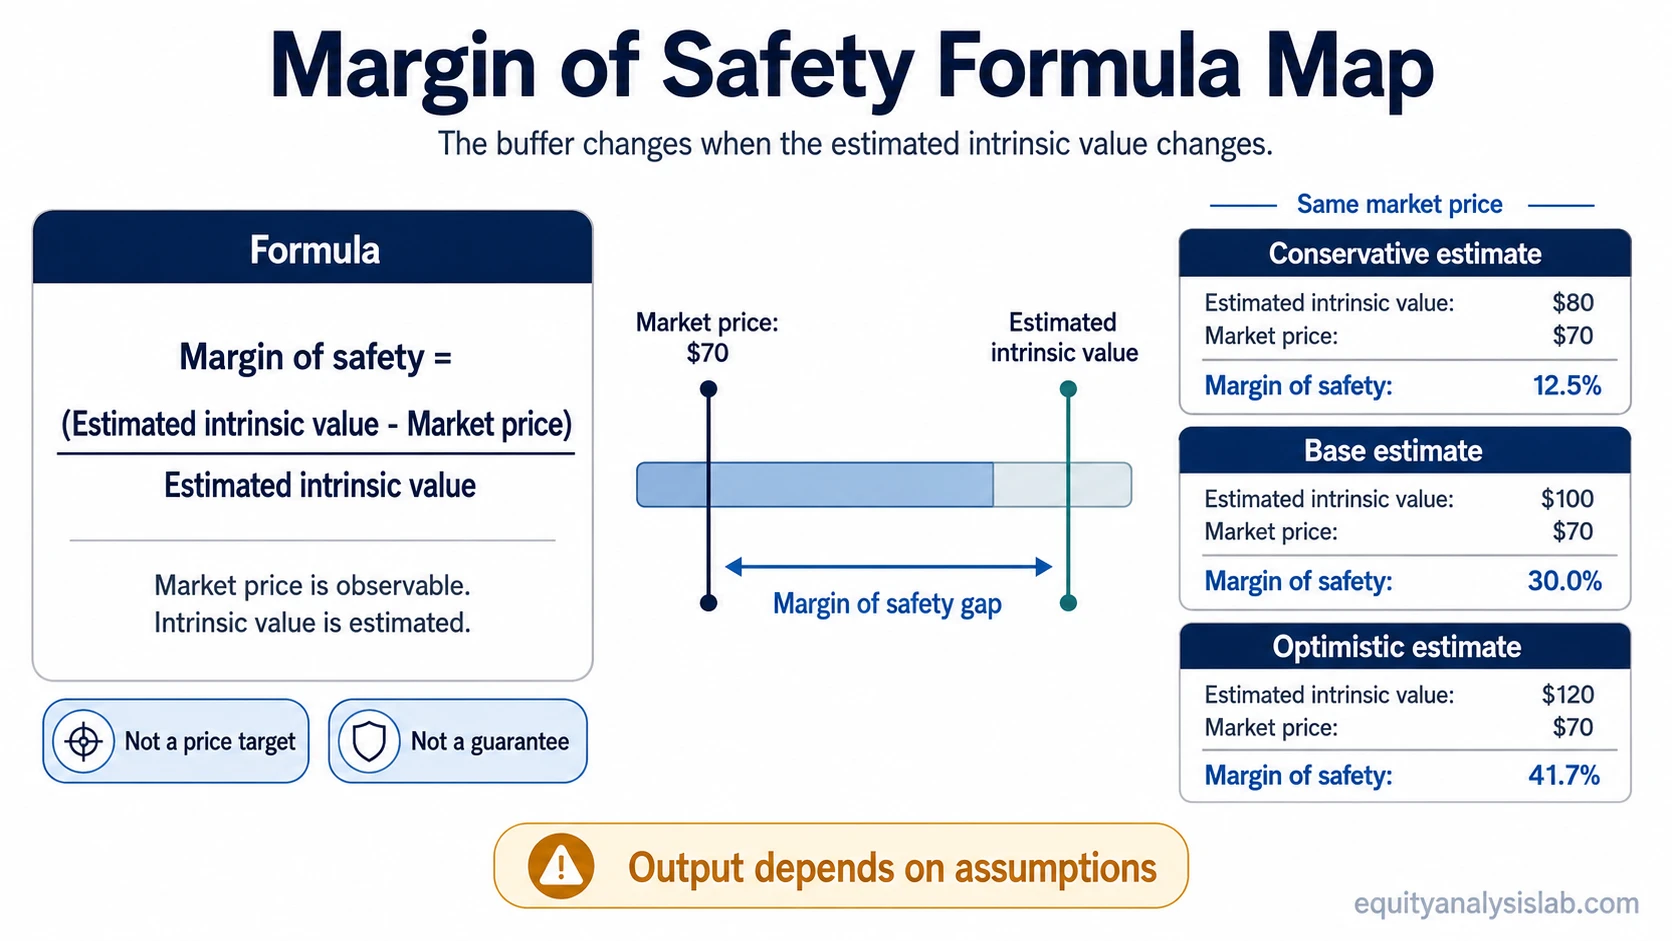
Margin of Safety = (Estimated Intrinsic Value – Market Price) / Estimated Intrinsic Value
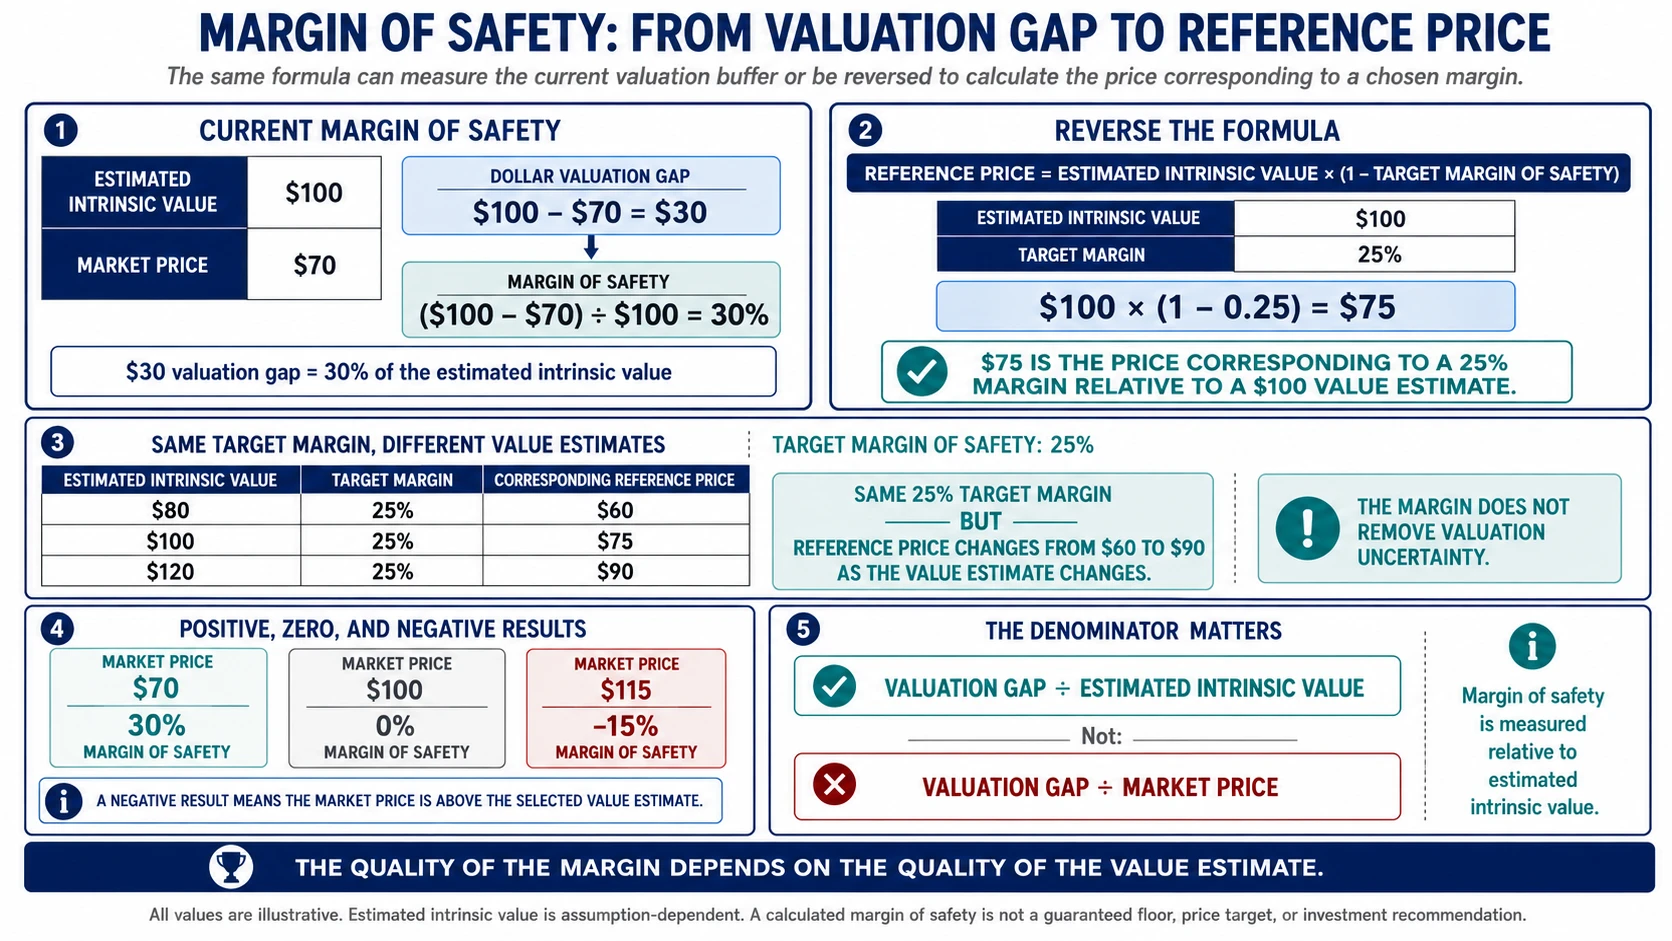
The numerator measures the estimated valuation gap between value and price. The denominator expresses that gap relative to the estimated intrinsic value. If the result is positive, market price is below the estimate. A zero result means price equals the estimate, while a negative result means market price is above it.
The denominator matters. Dividing the valuation gap by market price produces a different percentage and does not represent the standard investing margin-of-safety calculation used on this page.
The formula is only useful when the valuation estimate is built from realistic assumptions. An estimated fair value can help frame valuation risk, but it should not be treated as guaranteed support or a precise future trading price.
How to Calculate Margin of Safety
Assume a hypothetical company has an estimated intrinsic value of $100 per share and a current market price of $70 per share.
Illustrative calculation:
Margin of Safety = ($100 – $70) / $100
Margin of Safety = $30 / $100
Margin of Safety = 30%
Under those assumptions, market price is 30% below the estimated intrinsic value. The example is illustrative only. A different earnings base, cash-flow forecast, discount rate, growth assumption, or valuation method could produce a different value estimate and therefore a different margin of safety.
Margin of Safety in Dollars vs Percentage
The same valuation gap can be stated in dollar terms or percentage terms. These two figures describe the same relationship from different perspectives.
Using the same illustrative $100 intrinsic value estimate and $70 market price:
Dollar valuation gap = $100 – $70 = $30
Percentage margin of safety = $30 / $100 = 30%
| Measure | Formula | Illustrative Result |
|---|---|---|
| Dollar valuation gap | Estimated intrinsic value – Market price | $30 |
| Margin of safety percentage | Dollar valuation gap / Estimated intrinsic value | 30% |
Price Corresponding to a Target Margin of Safety
The formula can also be reversed. Instead of starting with the current market price, an analyst can start with an estimated intrinsic value and a selected target margin, then calculate the price that corresponds to that margin.
Reference Price = Estimated Intrinsic Value × (1 – Target Margin of Safety)
Assume estimated intrinsic value is $100 and the selected target margin is 25%.
Reference Price = $100 × (1 – 0.25)
Reference Price = $75
A $75 market price would therefore represent a 25% margin relative to a $100 intrinsic value estimate. The $75 figure is a mathematical reference price under those assumptions. It is not a recommended purchase price or a price target.
| Estimated Intrinsic Value | Target Margin of Safety | Corresponding Reference Price |
|---|---|---|
| $80 | 25% | $60 |
| $100 | 25% | $75 |
| $120 | 25% | $90 |
The target percentage is identical in all three cases, but the corresponding reference price changes from $60 to $90 because the estimated intrinsic value changes. A target margin therefore does not eliminate uncertainty in the valuation estimate.
Positive, Zero, and Negative Margin of Safety
The calculation can produce positive, zero, or negative results. Assume estimated intrinsic value remains fixed at $100.
| Market Price | Calculation | Margin of Safety | Meaning |
|---|---|---|---|
| $70 | ($100 – $70) / $100 | 30% | Market price is below the selected value estimate. |
| $100 | ($100 – $100) / $100 | 0% | Market price equals the selected value estimate. |
| $115 | ($100 – $115) / $100 | -15% | Market price is above the selected value estimate. |
A negative result does not predict that the stock price will fall. It only describes the relationship between the current market price and the specific intrinsic value estimate used in the calculation.
Why the Intrinsic Value Estimate Matters
Margin of safety is only as reliable as the valuation work behind it. Market price is observable, while estimated intrinsic value comes from assumptions. Changes in those assumptions can materially change the calculated buffer.
| Valuation Input | Why It Affects Margin of Safety |
|---|---|
| Earnings or cash-flow base | Normalized earnings and cash flow affect the starting point for valuation. |
| Growth assumption | Different expected growth rates can materially change the value estimate. |
| Discount rate or required return | A higher required rate of return usually lowers present-value estimates. |
| Terminal or exit assumptions | Long-term assumptions can account for a large portion of estimated value. |
| Balance-sheet and share-count adjustments | Debt, cash, other claims, and dilution can change the value attributable to each common share. |
The margin is calculated after the valuation estimate has been produced. If the value estimate is too optimistic, the calculated buffer can also be overstated.
Margin of Safety Sensitivity Example
The same market price can produce very different margin-of-safety readings when the estimated intrinsic value changes. Assume market price remains fixed at $70.
| Scenario | Estimated Intrinsic Value | Market Price | Margin of Safety |
|---|---|---|---|
| Conservative | $80 | $70 | 12.5% |
| Base | $100 | $70 | 30.0% |
| Optimistic | $120 | $70 | 41.7% |
The larger percentage in the optimistic scenario comes from the higher value estimate. The calculation therefore needs to be read together with the assumptions that produced the estimate.
What Margin of Safety Is Not
Margin of safety does not remove business risk, financial risk, valuation error, or the possibility that market price remains below estimated value for a long period.
- It is not a guaranteed floor under the stock price.
- It is not a precise statement of true value or a future price target.
- It is not a standalone investment signal.
- It is not a replacement for business, financial-statement, and valuation analysis.
A calculated margin should be reviewed alongside business quality, earnings durability, cash flow, balance-sheet risk, dilution, competitive position, and the cost of capital used in the valuation work.
Margin of Safety vs Accounting Margin of Safety
Investing margin of safety compares estimated intrinsic value with market price. Accounting margin of safety compares actual or expected sales with break-even sales. The terms use a similar buffer concept, but they measure different relationships.
| Use Case | What Is Compared | Main Question |
|---|---|---|
| Investing | Estimated intrinsic value vs market price | How large is the valuation gap relative to the estimate? |
| Accounting | Actual or expected sales vs break-even sales | How far can sales fall before break-even is reached? |
Related Valuation Concepts
Margin of safety sits inside a wider valuation framework. Intrinsic value, fair value, required return, and cost of capital influence the valuation estimate, while market value and ownership measures help define what is being compared.
- Market capitalization measures the market value of common equity using share price and shares outstanding.
- Equity value describes the value attributable to common shareholders after relevant claims and adjustments.
Market price is observable. Intrinsic value is estimated. Margin of safety measures the relationship between the two, so its usefulness ultimately depends on the assumptions behind the value estimate.
FAQ
What is margin of safety in investing?
Margin of safety is the percentage gap between estimated intrinsic value and market price. It is used to describe a valuation buffer relative to an estimate rather than to guarantee downside protection.
What is the margin of safety formula?
Margin of Safety = (Estimated Intrinsic Value – Market Price) / Estimated Intrinsic Value.
How do you calculate margin of safety?
If estimated intrinsic value is $100 and market price is $70, the dollar valuation gap is $30. Dividing $30 by the $100 intrinsic value estimate produces a 30% margin of safety.
How do you calculate a price for a target margin of safety?
Use Reference Price = Estimated Intrinsic Value × (1 – Target Margin of Safety). If estimated intrinsic value is $100 and the selected target margin is 25%, the corresponding reference price is $75.
What does a negative margin of safety mean?
A negative result means market price is above the selected intrinsic value estimate. It does not, by itself, predict what the stock price will do next.