A dividend discount model can look precise because it produces a value estimate, but the result is only as strong as the dividend, growth, required-return, and terminal assumptions behind it. The dividend discount model, or DDM, is a valuation method that estimates the value of common equity by discounting expected future dividends back to the present.
Dividend discount model definition: The dividend discount model estimates equity value from the present value of dividends a shareholder expects to receive in the future. It treats dividends as the cash return available to common shareholders, then discounts those expected payments using a required return or cost of equity.
Key points
- DDM values equity from expected future dividends, not from revenue, earnings, free cash flow, or peer multiples directly.
- The model is most useful when a company pays dividends consistently and the payout policy is reasonably stable.
- The estimate can change sharply when the dividend growth rate or required return changes.
- A DDM output is a valuation estimate under a chosen assumption set, not proof of fair value, not a price target, and not an investment recommendation.
What the dividend discount model means
The dividend discount model is a dividend-based equity valuation method. It starts from the idea that a common share is worth the present value of cash distributions shareholders expect to receive over time.
That makes DDM narrower than many other valuation methods. A business may generate earnings, operating cash flow, and free cash flow, but DDM focuses on the portion paid out as dividends. For that reason, the model fits companies where dividends are a meaningful part of shareholder return and where the payout policy reflects the economics of the business.
DDM should not be read as a complete investor decision. A stock can look cheap or expensive under one dividend assumption set and look different under another.
Dividend discount model formula
The general dividend discount model values a share as the present value of expected future dividends:
Value per share = D1 / (1 + r) + D2 / (1 + r)2 + D3 / (1 + r)3 + …
In this formula, D1, D2, and D3 represent expected dividends in future periods. The required return, shown as r, is the return an investor requires for the risk of owning the equity. Each future dividend is discounted because a dividend received later is worth less than the same amount received today.
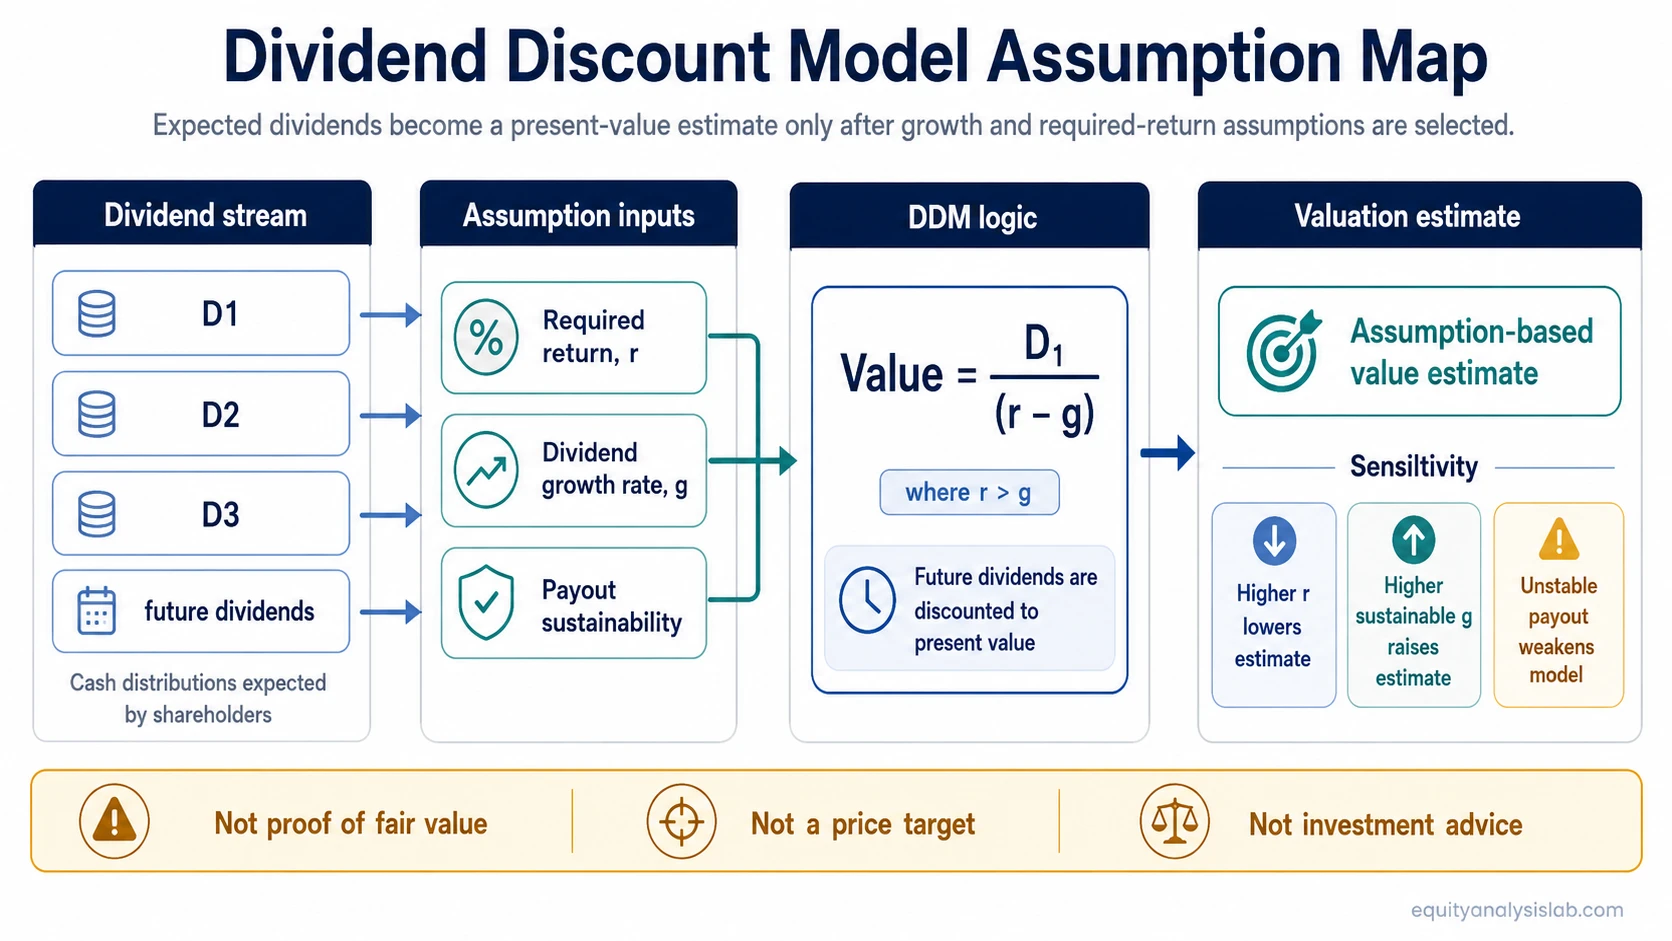
The Gordon Growth version is a compact form used when dividends are assumed to grow at a stable rate:
Value per share = D1 / (r – g), where r > g
| Formula input | What it means | Why it matters |
|---|---|---|
| D1 | Expected dividend next period | A higher expected dividend raises the estimate if other assumptions stay the same. |
| r | Required return or cost of equity | A higher required return lowers the present value of future dividends. |
| g | Expected long-term dividend growth rate | A higher growth assumption raises the estimate, but only if the growth is sustainable. |
The Gordon Growth formula only works when the required return is greater than the growth rate. If the growth rate approaches or exceeds the required return, the formula becomes unstable or unusable rather than more informative.
Assumptions behind the dividend discount model
DDM is less a single number than an assumption stack. The formula output changes when the dividend forecast, growth rate, required return, terminal assumption, payout policy, or dividend capacity changes.
| Assumption | Question to ask | Risk if ignored |
|---|---|---|
| Expected dividends | What dividends are likely to be paid? | The model may value a payout stream the company cannot or will not deliver. |
| Dividend growth rate | Can dividends grow without weakening the business? | A small growth overstatement can inflate the estimate. |
| Required return | What return compensates for the risk of the equity? | A low required return can make the estimate look attractive without enough risk compensation. |
| Terminal or perpetual assumption | What happens after the explicit forecast period? | The terminal assumption can dominate the estimate. |
| Payout policy | Will management keep distributing cash? | A change in payout policy can break the link between current dividends and future dividends. |
Dividend discount model example
Assume a company is expected to pay a dividend of $2.00 next year. If the required return is 8% and the long-term dividend growth assumption is 3%, the Gordon Growth version would estimate value as follows:
Illustrative estimate = $2.00 / (0.08 – 0.03) = $40.00 per share
This does not mean the share is worth exactly $40.00. It means that under those specific assumptions, the present value of the expected dividend stream is $40.00.
| Scenario | Dividend next year | Required return | Growth rate | DDM estimate |
|---|---|---|---|---|
| Base case | $2.00 | 8% | 3% | $40.00 |
| Lower growth | $2.00 | 8% | 2% | $33.33 |
| Higher required return | $2.00 | 9% | 3% | $33.33 |
The example shows why DDM is sensitive. A small change in growth or required return can change the valuation estimate even when the expected dividend is unchanged.
When the dividend discount model works best
DDM is strongest when dividends are not incidental. It works best when the company has a recurring dividend record, a payout policy that can be explained, and enough financial capacity to support future distributions.
| Best-fit situation | Why DDM can be useful |
|---|---|
| Mature dividend payer | Dividends may represent a meaningful part of shareholder return. |
| Stable payout policy | The dividend stream is easier to connect to long-term business economics. |
| Regulated or defensive business | Cash distributions may be more predictable than in cyclical or early-stage businesses. |
| Income-oriented equity analysis | The investor may care specifically about dividend capacity and distribution durability. |
Even in these cases, the dividend discount model should be compared with other valuation methods. A dividend stream can be stable while the business quality, balance sheet, or reinvestment opportunity set is changing.
When DDM is a weak fit
DDM becomes less useful when dividends do not represent the economic value being created by the business. A company can be valuable even if it pays no dividend, and a dividend can be high even when the underlying business is weakening.
Common mistake
A common mistake is treating a high dividend yield or a high DDM estimate as proof that a stock is cheap. The model may be reacting to an aggressive growth assumption, a required return that is too low, or a dividend that is not sustainable.
| Weak-fit situation | Why DDM may mislead |
|---|---|
| No dividend | The model has no current dividend stream to discount unless future dividends are estimated. |
| Irregular dividend payer | The forecast may depend more on management discretion than on a stable payout pattern. |
| Early-stage or high-growth company | Cash may be reinvested instead of distributed, so dividends may understate economic value. |
| Company with strained payout support | The current dividend may not be a reliable guide to future distributions. |
In these cases, a broader cash-flow model, peer multiple analysis, or asset-based method may explain the valuation question more directly than a dividend-only model.
Dividend discount model variations
Different DDM variations handle dividend growth in different ways. The right version depends on whether dividends are expected to remain flat, grow at a stable rate, or move through different growth stages.
| DDM variation | Core assumption | Best use |
|---|---|---|
| Zero-growth DDM | Dividends stay constant. | Stable dividend streams with no assumed growth. |
| Gordon Growth DDM | Dividends grow at a constant rate. | Mature dividend payers with stable long-term growth assumptions. |
| Multi-stage DDM | Dividend growth changes across forecast stages. | Companies transitioning from higher growth to mature payout behavior. |
A multi-stage model can be more realistic when dividend growth is expected to slow over time, but it also introduces more assumptions. More detail does not automatically make the output more reliable.
DDM vs DCF
DDM and discounted cash flow both use present-value logic, but they value different cash-flow streams. DDM discounts expected dividends. DCF usually discounts broader expected cash flows, such as free cash flow to the firm or free cash flow to equity.
| Method | Cash-flow stream | Typical fit |
|---|---|---|
| DDM | Expected dividends | Dividend-paying companies with stable payout policies. |
| DCF | Expected cash flows | Companies where cash generation is broader than current dividends. |
The choice between DDM and DCF depends on what cash-flow stream best represents the economic claim being valued. If dividends are the main shareholder cash return, DDM may be useful. If reinvestment, buybacks, debt changes, or free cash flow matter more, DCF may be more informative.
How DDM fits with other valuation methods
DDM is one valuation lens, not the entire valuation process. It can be compared with Relative valuation, Comparable company analysis, and other methods to see whether different approaches point toward similar or conflicting conclusions.
| Related concept | Why it matters for DDM |
|---|---|
| required rate of return | The discount rate can materially change the present value of future dividends. |
| terminal value | Long-term or perpetual assumptions can dominate present-value estimates. |
| dividend growth rate | The growth assumption is one of the most sensitive inputs in the Gordon Growth version. |
When different valuation methods disagree, the disagreement should be traced back to the assumptions. The useful question is not only which estimate is higher, but why the models disagree.
Limitations of the dividend discount model
The dividend discount model is sensitive to assumptions and narrow in scope. It can be useful for dividend-based equity analysis, but it should not be treated as proof that a stock is undervalued or overvalued.
- It depends heavily on dividend forecasts.
- It can become unstable when growth approaches the required return.
- It may undervalue companies that reinvest cash instead of paying dividends.
- It may overstate value if the dividend is not sustainable.
- It does not replace business quality, balance-sheet, earnings-quality, or cash-flow analysis.
Dividend discount model FAQ
What is the dividend discount model?
The dividend discount model is a valuation method that estimates the value of a share by discounting expected future dividends back to the present using a required return.
When is DDM most useful?
DDM is most useful for mature companies that pay regular dividends and have a payout policy that can be connected to earnings, cash flow, and long-term dividend capacity.
Why can DDM give very different valuation estimates?
DDM can give very different estimates because small changes in dividend growth, required return, or terminal assumptions can materially change the present value of future dividends.
Is DDM the same as DCF?
No. DDM discounts expected dividends, while DCF usually discounts broader expected cash flows. Both use present-value logic, but the cash-flow stream being valued is different.