ROE measures profit relative to shareholders’ equity, while ROIC measures operating profit relative to the broader capital invested in the business. The useful distinction is that ROE can look strong when the equity base is small or compressed, while ROIC tests how efficiently the company uses debt and equity capital together.
Return on equity is mainly an equity-holder profitability measure. Return on invested capital is a broader capital-efficiency measure. They can point in the same direction, but they can also tell different stories when leverage, buybacks, accounting profits, or capital intensity change the denominator.
Key Points
- ROE compares net income with average shareholders’ equity.
- ROIC usually compares NOPAT with invested capital.
- High ROE can be inflated by leverage, buybacks, or a compressed equity base.
- ROIC is useful for judging capital efficiency, but its usefulness depends on how NOPAT and invested capital are defined.
- Neither ratio proves business quality, valuation attractiveness, or future stock returns by itself.
What ROE and ROIC Measure Differently
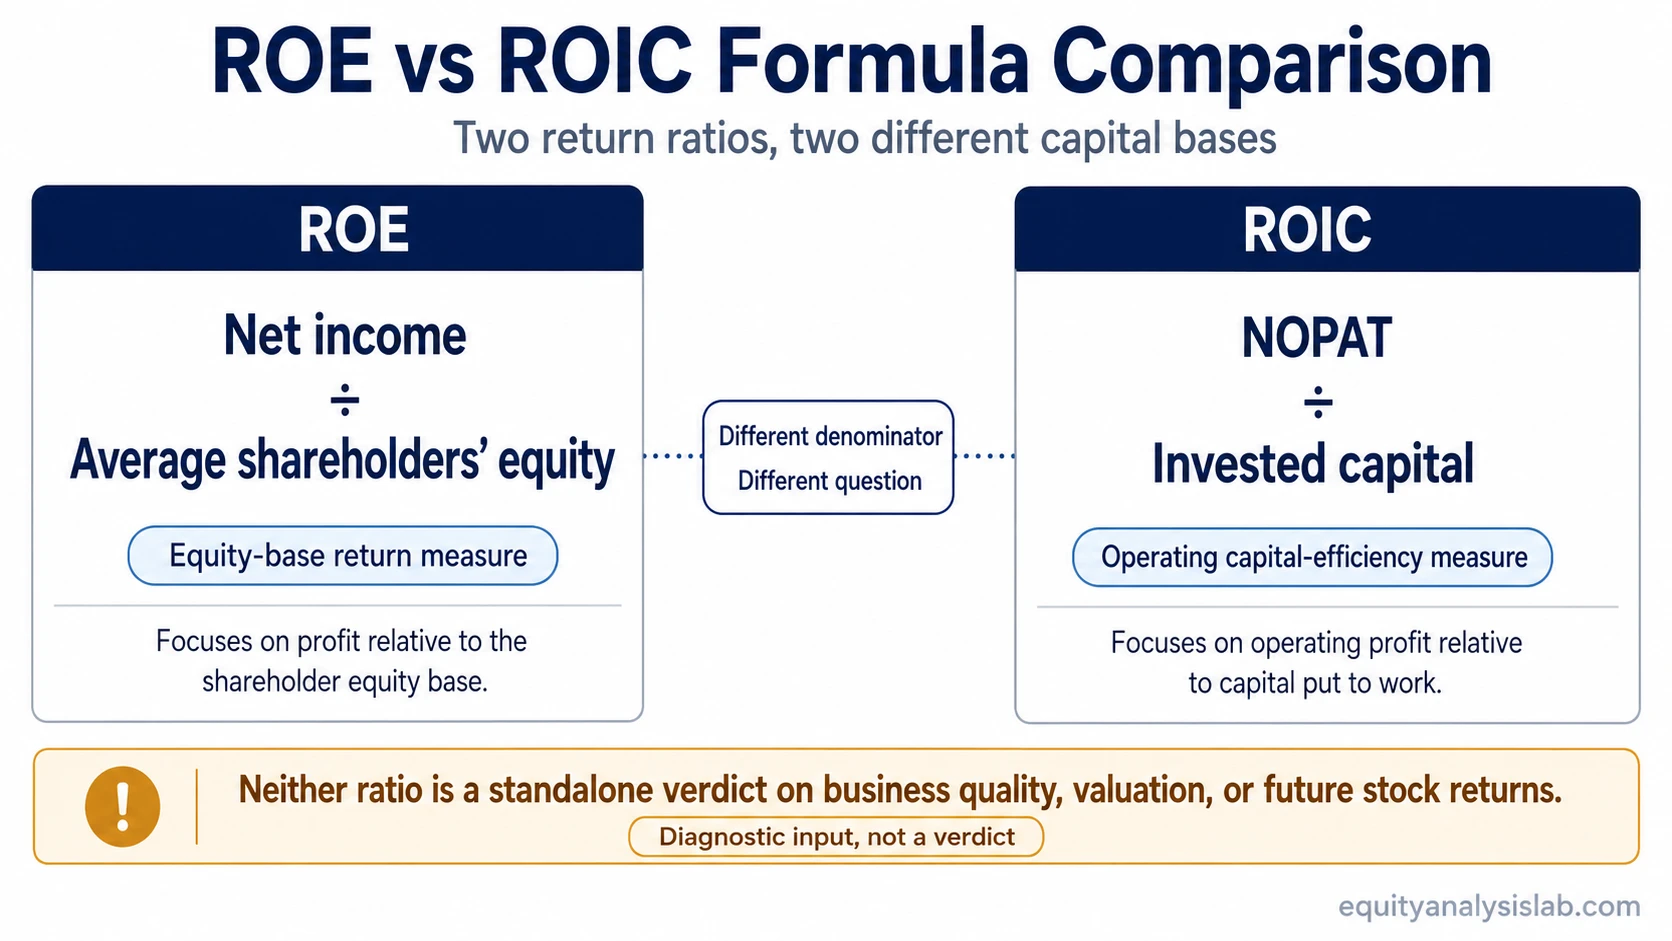
ROE asks how much net income a company produces for each dollar of shareholders’ equity. ROIC asks how much operating profit a company produces for the capital used in the business, including equity and debt-like capital depending on the definition used.
The difference matters because shareholders’ equity can shrink for reasons that do not automatically mean the business became better. Buybacks, accumulated losses, leverage, accounting charges, and capital structure choices can all change the equity base. ROIC can reduce some equity-base distortion by looking at a broader capital base, but it still depends on how NOPAT and invested capital are defined.
Core distinction: ROE is an equity-base return measure. ROIC is an operating capital-efficiency measure. ROE focuses on what belongs to common shareholders; ROIC focuses on how productively the operating business uses the capital put to work.
ROE vs ROIC Comparison Table
| Criterion | ROE | ROIC |
|---|---|---|
| Full name | Return on equity | Return on invested capital |
| Basic formula | Net income ÷ average shareholders’ equity | Commonly NOPAT ÷ invested capital |
| Main numerator | Net income after interest, taxes, and non-operating items | Net operating profit after tax, before financing structure effects |
| Main denominator | Shareholders’ equity | Operating capital invested in the business |
| Main question answered | How much profit is generated relative to the equity base? | How efficiently does the business generate operating profit from capital employed? |
| Common distortion | Can rise when equity is reduced by buybacks, leverage, losses, or accounting effects | Can vary based on NOPAT and invested-capital adjustments |
| Best use | Understanding shareholder-equity profitability when the equity base is meaningful and stable | Comparing capital efficiency across companies with different leverage or capital intensity |
Why ROE and ROIC Can Disagree
ROE and ROIC can disagree because they do not use the same numerator or denominator. ROE includes the effects of financing choices because net income is measured after interest expense. ROIC usually starts from operating profit after tax, so it evaluates the operating business before the final effect of capital structure.
The denominator difference is often the bigger issue. If shareholders’ equity becomes smaller, ROE can rise even when the business has not improved much. A company that borrows heavily, repurchases shares, or carries a reduced book equity base may show a high ROE because the denominator is low. ROIC may remain more moderate if the broader invested capital base is still large.
Important limitation: A higher ROE is not automatically better than a lower ROE, and a higher ROIC is not automatically a better investment. Profit quality, debt load, capital intensity, reinvestment needs, peer set, accounting definitions, and valuation context all change the interpretation.
Same-Company Example: High ROE but More Moderate ROIC
Illustrative example: Imagine a company earns $100 million in net income and has $500 million of average shareholders’ equity. Its ROE is 20%.
If the same business has $900 million of invested capital and produces $120 million of NOPAT, its ROIC is about 13.3%. The business may still be profitable, but the two ratios are not saying the same thing. ROE is comparing profit with the equity base, while ROIC is comparing operating profit with the broader capital required to run the business.
The interpretation changes further if the equity base became smaller because of buybacks or leverage. ROE may look stronger because shareholders’ equity was compressed, not because the operating business suddenly became more efficient. ROIC gives a second check on whether the company is earning attractive operating returns on the total capital base.
When ROE Is More Useful
ROE is more useful when the question is specifically about profitability relative to shareholders’ equity. It can help investors understand how much accounting profit a company produces compared with the equity capital reported on the balance sheet.
The ratio becomes more informative when earnings quality is strong, the equity base is not unusually compressed, and the company is compared with peers that have similar accounting and capital-structure characteristics. ROE can be especially relevant in sectors where equity capital is central to the business model, although financial companies often require sector-specific interpretation because their balance sheets and leverage structures differ from ordinary operating companies.
Useful ROE context: Check whether net income is recurring, whether equity has been reduced by buybacks or accumulated losses, and whether debt is carrying more of the capital burden than the equity figure suggests.
When ROIC Is More Useful
ROIC is more useful when the main question is whether the operating business earns enough profit on the capital required to run it. That makes it useful for comparing companies with different leverage profiles, reinvestment needs, or levels of capital intensity.
ROIC can help separate a business that is genuinely efficient from one that looks attractive mainly because of financial structure. A company with strong ROE but weak or average ROIC may be benefiting from a smaller equity base. A company with strong ROIC is showing that the operating engine earns meaningful profit on a broader capital base, although the exact conclusion still depends on the definition of invested capital.
ROIC is often compared with a company’s cost of capital, but that comparison should stay qualified. A spread above the cost of capital can suggest value creation, yet the calculation depends on durable margins, reinvestment opportunities, accounting adjustments, and the reliability of the inputs.
Common Mistake: Treating ROIC as Always Better Than ROE
Common mistake: ROIC is often cleaner for operating capital-efficiency analysis, but it is not automatically the “better” ratio in every context. ROE and ROIC answer different questions.
ROE can be the right lens when the equity base is meaningful and the investor wants to understand shareholder-equity profitability. ROIC can be the better lens when the investor wants to understand operating efficiency across debt and equity capital. The mistake is ranking the ratios before checking what each ratio is measuring, what is inside the numerator, and why the denominator looks the way it does.
How to Read ROE and ROIC Together
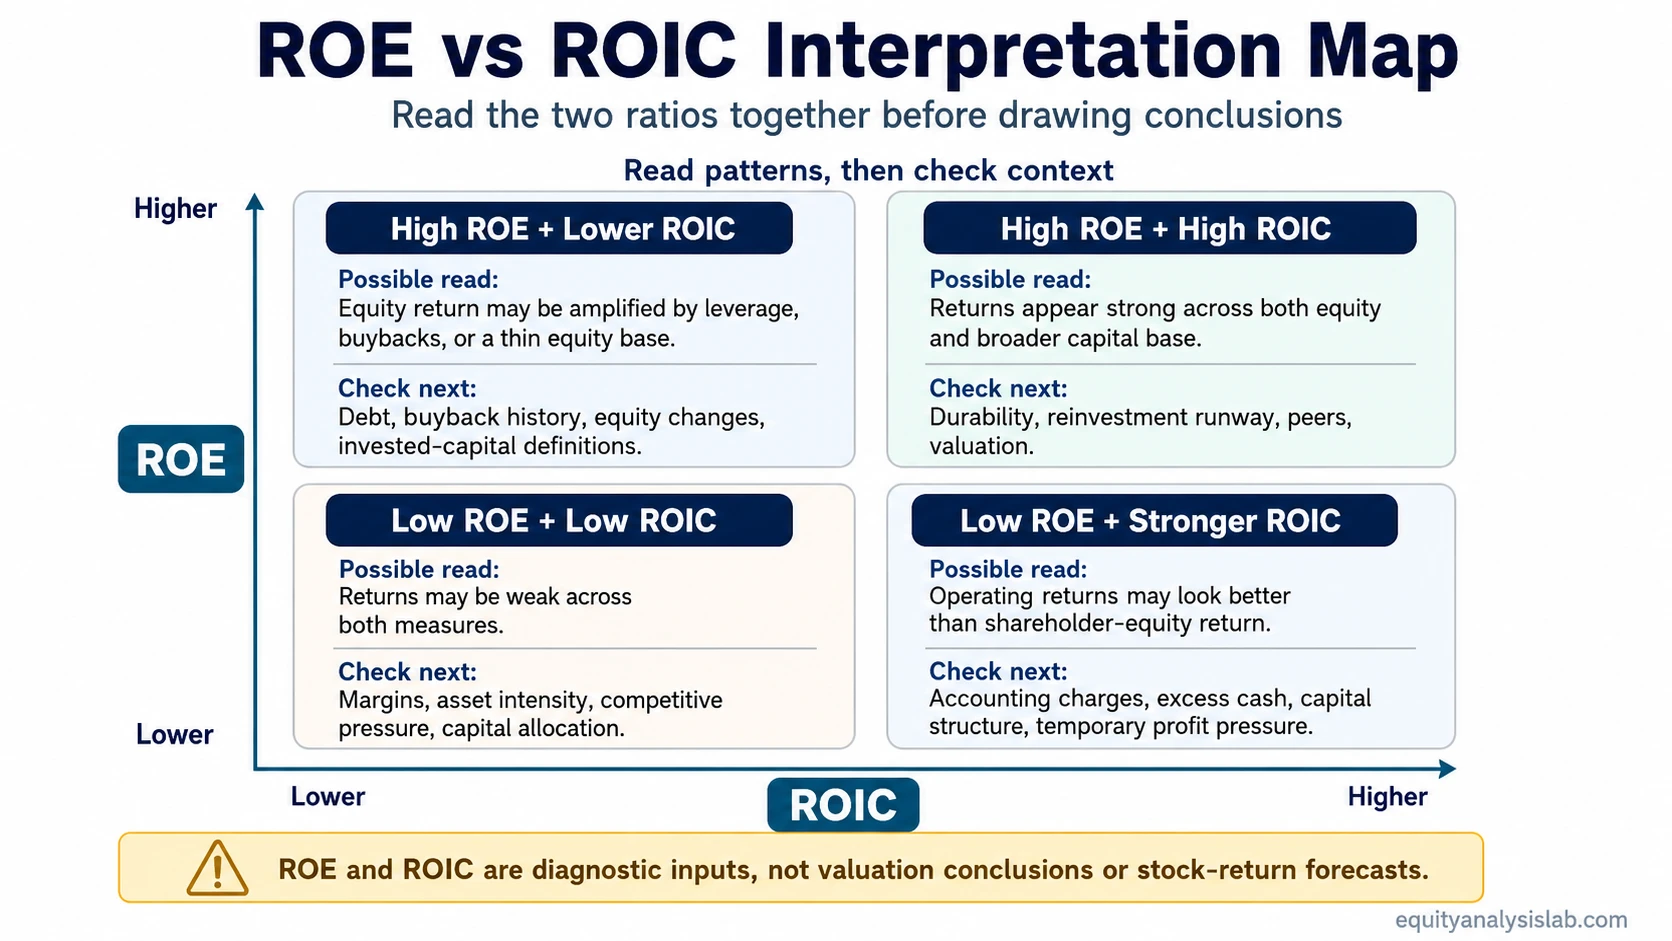
The strongest interpretation usually comes from reading both ratios side by side. A high ROE with a high ROIC can suggest that profitability is supported by both shareholder-equity returns and broader capital efficiency. A high ROE with a much lower ROIC deserves closer inspection because leverage, buybacks, or a thin equity base may be amplifying the equity return.
| ROE / ROIC Pattern | Possible Interpretation | What to Check Next |
|---|---|---|
| High ROE and high ROIC | The company may be generating strong returns for both shareholders and the broader capital base. | Check durability, reinvestment runway, peer comparison, and valuation. |
| High ROE but lower ROIC | Equity-base returns may be amplified by leverage, buybacks, or a small book equity base. | Check debt, buyback history, equity changes, and invested-capital definitions. |
| Low ROE but stronger ROIC | The operating business may be more efficient than the shareholder-equity return suggests. | Check accounting charges, excess cash, capital structure, and temporary profit pressure. |
| Low ROE and low ROIC | The business may be earning weak returns on both equity and invested capital. | Check margin structure, asset intensity, competitive pressure, and capital allocation. |
What ROE and ROIC Do Not Tell You
ROE and ROIC are profitability and capital-efficiency measures, not complete investment conclusions. They do not tell whether a stock is cheap, whether earnings will grow, whether management will allocate capital well, or whether future returns will be attractive.
The interpretation weakens when the numerator is temporary, the denominator is distorted, or the business model requires heavy reinvestment that the ratio does not fully explain. A ratio can look strong while cash conversion is weak, competitive pressure is rising, debt risk is increasing, or valuation already reflects optimistic assumptions.
Investor-use boundary: Use ROE and ROIC as diagnostic inputs. Do not use either ratio as a standalone verdict on company quality, valuation attractiveness, balance-sheet safety, or expected stock performance.
Which Ratio Should Investors Use?
The better question is not whether ROE or ROIC is superior. The better question is which capital base matches the decision being made.
| Investor question | Better starting lens | Why |
|---|---|---|
| How profitable is the business relative to shareholders’ equity? | ROE | ROE directly compares net income with the equity base. |
| How efficiently does the operating business use capital? | ROIC | ROIC compares operating profit with invested capital. |
| Could leverage or buybacks be inflating the return figure? | ROE and ROIC together | The comparison can reveal whether the equity-base return is much stronger than the broader capital return. |
| Is the company attractive at the current price? | Neither ratio alone | Valuation requires price, cash flows, growth expectations, risk, and durability of returns. |
FAQ
Is ROIC better than ROE?
ROIC is not automatically better than ROE. ROIC is often useful for operating capital-efficiency analysis because it looks at a broader capital base, but ROE is still useful when the question is profitability relative to shareholders’ equity.
Why can ROE be high when ROIC is lower?
ROE can be high when shareholders’ equity is small or compressed by leverage, buybacks, accounting effects, or accumulated losses. ROIC may be lower because it compares operating profit with a broader invested-capital base.
Can ROE or ROIC show whether a stock is cheap?
No. ROE and ROIC can help analyze profitability and capital efficiency, but valuation depends on price, cash flows, growth expectations, balance-sheet risk, reinvestment needs, and the durability of returns.