Return on equity measures net income generated for each dollar of average shareholders’ equity. It helps investors judge profitability relative to the equity base, but it can mislead when leverage, buybacks, negative equity, or one-off profits distort the denominator or numerator.
Return on equity, often shortened to ROE, is a profitability and capital-efficiency ratio that compares net income with average shareholders’ equity. It asks a narrow question: how much profit did the company generate relative to the accounting equity capital attributable to common shareholders?
Key points about return on equity
- ROE compares net income with average shareholders’ equity.
- ROE is usually expressed as a percentage.
- A high ROE can reflect strong profitability, but it can also reflect leverage, buybacks, or a shrinking equity base.
- ROE is more reliable when it is checked against peer performance, the company’s own trend, leverage, earnings quality, and cash-flow support.
What return on equity means
Return on equity shows how efficiently a company turns its shareholders’ equity base into accounting profit. A company with positive net income and positive shareholders’ equity will usually report ROE as a positive percentage. The higher the percentage, the more net income the company produced for each dollar of average equity during the period.
That does not mean a higher ROE is automatically better. The ratio depends on both sides of the calculation. ROE can rise because the business earns more, but it can also rise because the equity base becomes smaller. That denominator effect is why ROE needs more context than a headline percentage.
For investors, ROE is best treated as a diagnostic ratio. It can support company analysis, but it should not replace earnings-quality review, cash-flow analysis, balance-sheet review, valuation work, or a comparison against similar companies.
Return on equity formula
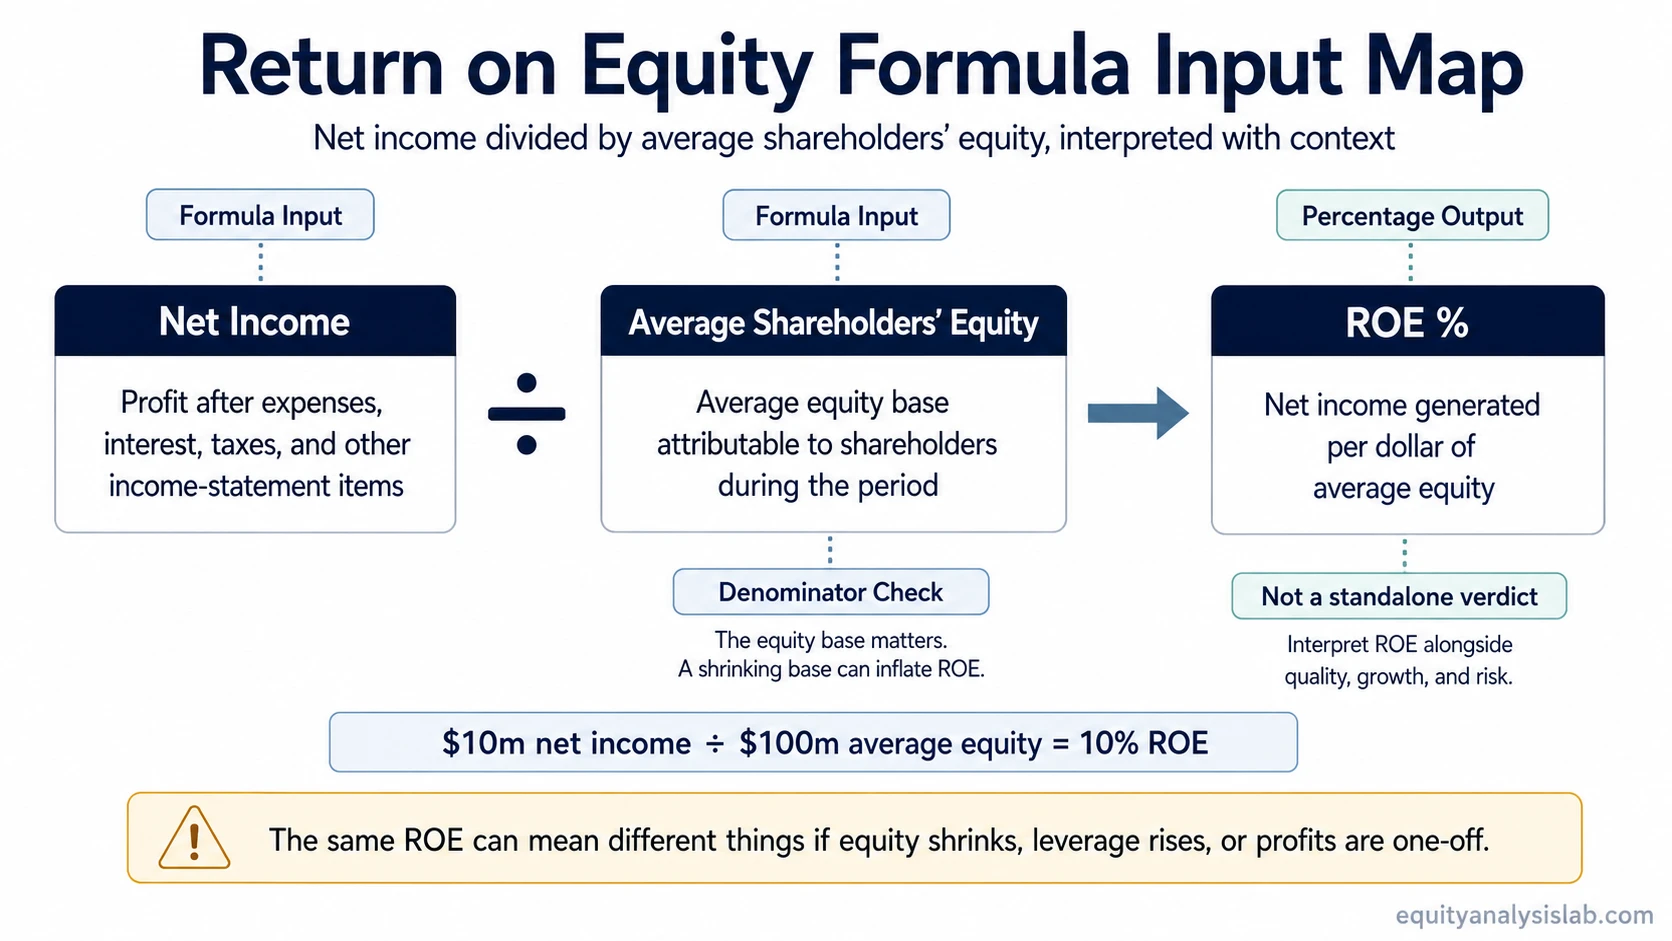
Return on Equity = Net Income / Average Shareholders’ Equity
The result is normally converted into a percentage by multiplying by 100. If a company earns 10% ROE, it generated ten cents of net income for each dollar of average shareholders’ equity during the period measured.
| Formula input | What it represents | Why it matters for interpretation |
|---|---|---|
| Net income | Profit after expenses, interest, taxes, and other items included in the income statement. | ROE is stronger when net income is recurring, cash-supported, and not driven mainly by one-off gains. |
| Average shareholders’ equity | The average equity base attributable to shareholders over the period. | ROE can look higher if the equity base shrinks because of losses, buybacks, leverage, or accounting effects. |
| Percentage output | The amount of net income generated per dollar of average equity. | The number needs peer, trend, leverage, and business-model context before it says much about quality. |
Why average shareholders’ equity matters
The denominator is one of the most important parts of ROE. Many investors look first at the percentage, but the equity base explains whether that percentage is being supported by real profitability or inflated by a smaller denominator.
Average shareholders’ equity is usually preferred over ending shareholders’ equity because the balance-sheet base can move during the period. A company may repurchase shares, retain earnings, record losses, issue shares, write down assets, or change its capital structure. Using an average can reduce the risk of reading one period-end balance as if it represented the whole period.
A high ROE becomes more useful when profits are durable and the equity base is not being artificially compressed. If net income is weak, volatile, or heavily adjusted, the ROE number may look precise while the underlying profit quality remains questionable.
How to interpret ROE as a percentage
ROE translates the formula into a percentage. A 15% ROE means the company generated $0.15 of net income for every $1.00 of average shareholders’ equity during the measured period.
The percentage should be interpreted against similar companies, the company’s own history, and the economics of the industry. Capital-light businesses can often produce higher ROE than capital-intensive businesses because they need less equity capital to generate profit. A low ROE can signal weak profitability, but it can also appear during reinvestment phases, cyclical downturns, restructuring periods, or early stages of business expansion.
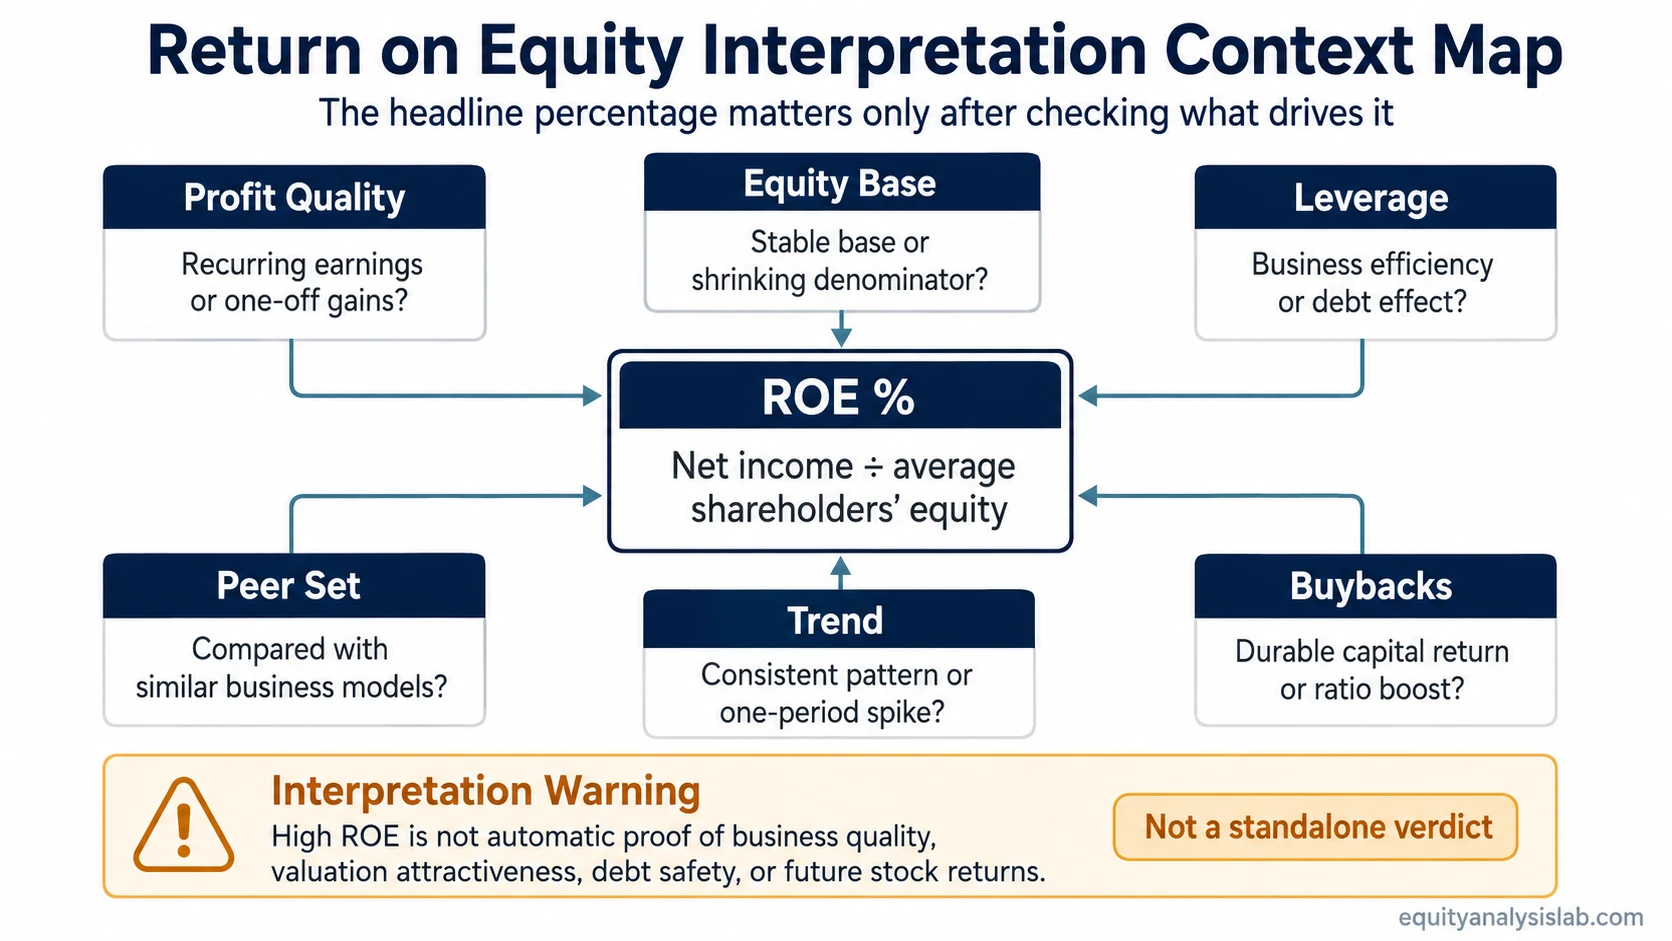
The useful question is not simply whether ROE is high or low. The better question is what is driving the number: stronger earnings, better margins, improved asset use, higher leverage, a lower equity base, or a temporary accounting effect.
ROE interpretation context table
ROE is more informative when the numerator and denominator are read together. The same headline percentage can mean very different things depending on profit quality, leverage, equity base, and company lifecycle.
| ROE pattern | Possible interpretation | What to check before relying on it |
|---|---|---|
| High ROE with stable equity and recurring profit | May indicate strong profitability and efficient use of shareholder capital. | Compare margins, cash conversion, peer performance, and whether earnings quality is durable. |
| High ROE with rising debt | May reflect leverage rather than purely better business economics. | Review the debt-to-equity ratio, interest burden, and balance-sheet risk. |
| Rising ROE with a shrinking equity base | May be helped by buybacks, accumulated losses, write-downs, or other denominator effects. | Check whether net income is improving or whether the denominator is simply becoming smaller. |
| Low ROE during heavy reinvestment | May reflect a business still building its earnings base rather than a permanently weak company. | Compare revenue quality, margins, cash flow, and whether reinvestment is producing better future economics. |
| Negative ROE | Often means net income is negative, equity is negative, or the ratio has become hard to interpret cleanly. | Identify whether the issue comes from losses, negative shareholders’ equity, unusual charges, or balance-sheet stress. |
Why high ROE can mislead
High ROE can create false confidence if the ratio is read without context. The most common mistake is treating ROE as proof of business quality when the number may be driven by the capital structure or the accounting base.
Leverage can inflate ROE. If a company uses more debt and less equity, the same level of profit can produce a higher ROE. That may improve the ratio, but it can also increase financial risk.
Buybacks can raise ROE by reducing equity. Repurchases can be a legitimate capital-allocation tool, but they may also make ROE look stronger by shrinking shareholders’ equity. The ratio is more meaningful when buybacks are supported by durable earnings and cash flow.
Negative equity can make ROE unreliable. When shareholders’ equity is negative or unusually small, ROE may become mathematically awkward. A very high or negative result may say more about the denominator than about business quality.
One-off profits can distort the numerator. A company can report a temporary jump in net income because of non-recurring gains, tax effects, asset sales, or accounting adjustments. In that case, ROE may improve for a period without showing a durable improvement in the underlying business.
Industry differences matter. ROE should not be compared mechanically across unrelated business models. A software company, bank, retailer, utility, and manufacturer may have very different capital structures and equity requirements.
How investors can use ROE without overusing it
ROE works best as part of a sequence, not as a standalone filter. It can help identify whether a company is generating attractive profits relative to its equity base, but the next step is to understand why the ratio looks the way it does.
A stronger ROE read usually has several supporting features: recurring net income, cash-flow support, a stable or explainable equity base, reasonable leverage, and performance that compares well with relevant peers. A weaker ROE read often depends on one-off earnings, aggressive leverage, a shrinking denominator, or a business model that is being compared with the wrong peer set.
ROE can support an investment thesis, but it cannot make the thesis alone. It should sit beside earnings quality, free cash flow, balance-sheet strength, valuation, capital allocation, and the company’s ability to reinvest at attractive returns.
ROE compared with nearby metrics
ROE overlaps with several other profitability and capital-efficiency ratios, but each ratio answers a different question. Keeping the boundaries clear prevents ROE analysis from turning into a broad profitability-ratio review.
| Metric or concept | Main question it answers | How it differs from ROE |
|---|---|---|
| Return on assets | How much profit is generated relative to the asset base? | ROA uses total assets, while ROE focuses on shareholders’ equity. |
| Return on invested capital | How much return is generated on the broader capital invested in the business? | ROIC looks beyond common equity and is often used to assess returns on operating capital. |
| DuPont analysis | What components are driving ROE? | DuPont analysis decomposes ROE into drivers such as profitability, asset efficiency, and leverage, but a full decomposition belongs outside this ROE definition page. |
| ROE vs ROIC | Which return metric is more useful for a specific analysis? | The comparison is useful when equity returns and invested-capital returns tell different stories. |
Simple return on equity calculation example
Suppose a company earns $10 million of net income and has $100 million of average shareholders’ equity during the period.
ROE = $10 million / $100 million = 10%
That 10% ROE means the company generated $0.10 of net income for each $1.00 of average shareholders’ equity. The same 10% result would be interpreted differently if the equity base had just fallen sharply because of buybacks or accumulated losses.
A more complete read would ask whether the net income is recurring, whether cash flow supports the profit, whether leverage is reasonable, whether buybacks changed the equity base, and how the ratio compares with similar companies over several periods.
Common mistakes when reading ROE
| Mistake | Safer interpretation |
|---|---|
| Treating high ROE as automatic proof of quality | High ROE may reflect a strong business, but it can also reflect leverage, buybacks, a small equity base, or temporary earnings. |
| Comparing unrelated industries | ROE is more useful within a relevant peer group because capital intensity and balance-sheet structure vary widely across industries. |
| Ignoring the denominator | A rising ROE can come from falling equity, not only rising profit. That is why shareholders’ equity mechanics matter. |
| Using ROE as a stock-picking shortcut | ROE is a company-analysis input, not a buy signal, valuation conclusion, or forecast of future stock returns. |
When ROE is most useful
ROE is most useful when it is stable or improving for understandable reasons: durable profits, reasonable leverage, cash-flow support, and a consistent equity base. It becomes weaker when volatile earnings or denominator distortion explain more of the result than operating improvement.
A multi-year trend is usually more informative than a single period because one year can be affected by one-off gains, restructuring charges, asset write-downs, or unusually strong cyclical conditions.
ROE should help frame the question, not close the decision.
FAQ
Can a high ROE be misleading?
Yes. A high ROE can be misleading when it is driven by leverage, buybacks, a shrinking equity base, negative equity, one-off profits, or accounting effects rather than durable operating improvement.
Why can buybacks make ROE look higher?
Buybacks can reduce shareholders’ equity. If net income stays stable while the equity base shrinks, ROE can rise even if the underlying business has not become more profitable.
Is ROE the same as ROIC?
No. ROE compares net income with shareholders’ equity, while ROIC focuses on returns generated from a broader invested-capital base. The difference matters when leverage or capital structure changes the ROE result.