Operating margin is operating income divided by revenue, usually shown as a percentage. It measures how much revenue remains after cost of goods sold and operating expenses, but before interest, taxes, and non-operating items.
Definition: Operating margin is a profitability ratio that compares a company’s operating income with its revenue. It focuses on core business profitability before financing costs and taxes enter the income statement.
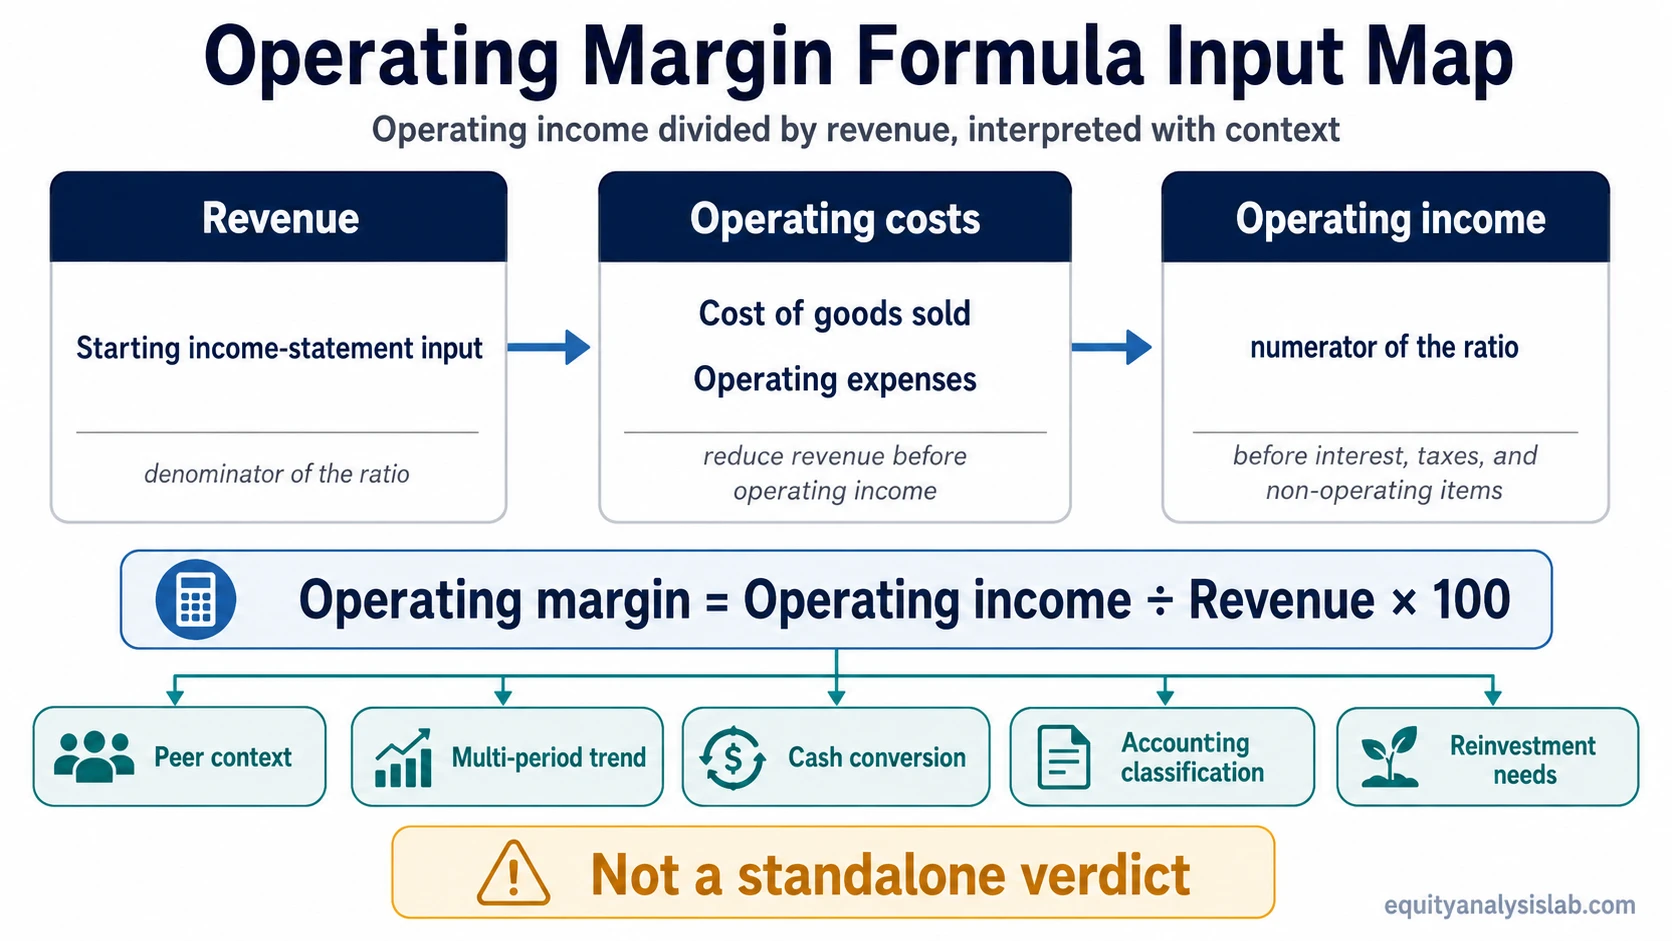
The ratio becomes more useful when the percentage is traced back to its source: revenue quality, cost structure, operating expense discipline, accounting treatment, and the durability of operating profit.
Key Points
- Operating margin equals operating income divided by revenue.
- It shows operating profitability before interest, taxes, and non-operating gains or losses.
- Both inputs matter: margin can change because revenue changes, operating costs change, or both move at the same time.
- A high operating margin is not automatically better without peer, business-model, and durability checks.
- Operating margin is accrual-based, so cash conversion and reinvestment needs still matter.
Operating Margin Formula
The operating margin formula is:
Operating margin = Operating income ÷ Revenue × 100
Operating income is the profit left after subtracting cost of goods sold and operating expenses from revenue. It is often close to EBIT when the income statement separates operating profit from interest, taxes, and non-operating items, but the exact label can vary by reporting format.
Revenue is the denominator, so the ratio asks how much operating profit the company earns from each unit of sales. For example, a 20% operating margin means the company produces 20 cents of operating income for every dollar of revenue before financing costs and taxes.
Operating Margin Formula Inputs
Operating margin is more useful when the numerator and denominator are read separately. A stable percentage can hide very different business conditions if revenue, cost of goods sold, and operating expenses are moving in different directions.
| Input | Where it comes from | Effect on operating margin | Interpretation caution |
|---|---|---|---|
| Revenue or net sales | Top line of the income statement | Forms the denominator of the ratio | Revenue growth can improve scale, but weak pricing, discounts, or mix shifts can still pressure margin. |
| Cost of goods sold | Income statement cost section | Reduces gross profit before operating expenses | Input costs, production efficiency, supplier terms, and product mix can change the operating-margin base. |
| Operating expenses | Selling, general, administrative, research, marketing, and other operating cost lines | Reduce operating income | Expense cuts can lift margin temporarily if they reduce needed reinvestment in growth or product quality. |
| Operating income | Income statement profit line before interest and taxes | Forms the numerator of the ratio | One-off charges, restructuring costs, and accounting classifications can affect comparability. |
| Interest, taxes, and non-operating items | Below the operating income line | Excluded from operating margin | Debt burden, tax rate, investment gains, and losses still matter, but they belong outside operating margin. |
Simple Operating Margin Example
Illustrative example: A hypothetical company reports $500 million of revenue and $90 million of operating income. Its operating margin is $90 million divided by $500 million, or 18%.
The same 18% margin can have different meanings. If revenue grew while fixed operating costs rose more slowly, the result may point to improving operating leverage. If the margin rose mainly because research, marketing, or maintenance spending was cut, the improvement may be less durable.
Cash conversion changes the interpretation as well. An 18% operating margin supported by steady operating cash flow is different from an 18% margin accompanied by weak collections, rising working-capital needs, or deferred reinvestment.
How Investors Interpret Operating Margin
Operating margin helps investors evaluate core profitability before capital structure and tax effects. It can point to pricing power, cost discipline, scale benefits, operating leverage, or expense pressure, depending on what changed inside the income statement.
Peer comparison matters because margin structure differs across business models. A software company, retailer, manufacturer, bank, and commodity producer can have very different normal margin ranges. A margin that looks strong in one industry may be ordinary or weak in another.
Trend analysis matters as much as the latest level. Rising operating margin can suggest improving scale or cost control, but it can also reflect temporary expense cuts. Falling operating margin can suggest pricing pressure, cost inflation, growth investment, mix deterioration, or temporary restructuring costs.
Operating margin measures profitability, while asset turnover ratio measures how efficiently a company uses assets to generate revenue. A company can have strong margins and weak asset efficiency, or thinner margins and faster asset turnover.
What Operating Margin Does Not Show
Operating margin is an income-statement ratio, not a complete measure of business quality or investment attractiveness. It does not show whether accounting profit is converting into cash, whether the balance sheet carries heavy debt, or whether the company needs large capital spending to maintain operations.
Limitation: A high operating margin can be misleading when it is supported by temporary cost cuts, favorable accounting treatment, one-off benefits, or underinvestment. Profitability is more durable when operating profit is backed by cash generation and enough reinvestment to sustain the business model.
| Missing angle | Why operating margin does not answer it | What to check next |
|---|---|---|
| Cash conversion | Operating margin is accrual-based and may differ from cash generated by operations. | Operating cash flow, free cash flow, working capital, and capital expenditures. |
| Debt burden | Interest expense is excluded from operating income. | Interest coverage, leverage ratios, maturity profile, and refinancing risk. |
| Tax structure | Taxes are below the operating income line. | Effective tax rate and sustainability of tax benefits. |
| Capital intensity | Operating margin does not show required maintenance investment. | Capital expenditures, depreciation, reinvestment needs, and free cash flow. |
| One-off effects | Reported operating income may include unusual costs or benefits depending on classification. | Adjusted operating income, footnotes, management discussion, and recurring cost structure. |
Operating Margin vs Gross Margin vs Net Margin
Margin ratios measure different layers of profitability. The distinction matters because each ratio answers a different income-statement question.
| Metric | What it compares | Main use | Boundary |
|---|---|---|---|
| gross margin | Gross profit divided by revenue | Shows production-level or direct-cost profitability before operating expenses | Does not include selling, administrative, research, marketing, and other operating costs. |
| Operating margin | Operating income divided by revenue | Shows core business profitability after operating expenses | Excludes interest, taxes, and non-operating gains or losses. |
| net margin | Net income divided by revenue | Shows bottom-line profitability after all expenses | Includes financing costs, taxes, non-operating items, and other below-operating-line effects. |
A company can have a healthy gross margin but weak operating margin if overhead, research, marketing, or administrative costs consume too much of the gross profit. A company can also have a healthy operating margin but weak net margin if debt costs, taxes, or non-operating losses reduce bottom-line profit.
Common Operating Margin Mistakes
Mistake: Treating a higher operating margin as automatically better can hide business-model differences, weak reinvestment, or temporary expense reductions.
- Comparing unrelated industries: Operating margin ranges differ by business model, cost structure, and capital intensity.
- Ignoring the trend: A single-year margin may miss improving or deteriorating economics.
- Ignoring revenue quality: Margin improvement is less useful if revenue is shrinking, heavily discounted, or shifting toward weaker segments.
- Confusing margin with cash flow: Operating margin can look strong while working capital or capital spending reduces cash generation.
- Ignoring one-off items: Restructuring, accounting classifications, and temporary cost actions can distort the operating-income line.
- Using fixed thresholds: A universal “good” operating margin threshold can mislead when peer economics are different.
Operating Margin Interpretation Checklist
A stronger operating margin reading combines the ratio with questions about source, durability, and comparability.
| Question | Why it matters |
|---|---|
| Is the margin high relative to direct peers? | Peer context separates business-model strength from industry-normal economics. |
| Is the margin improving or weakening over several periods? | Trend direction often matters more than one reported percentage. |
| Did revenue growth, price, cost control, or expense cuts drive the change? | The same margin result can come from very different operating conditions. |
| Does operating profit convert into cash flow? | Accrual profitability is stronger when supported by actual cash generation. |
| Are reinvestment needs being deferred? | Short-term margin gains can weaken long-term durability if needed spending is cut too aggressively. |
FAQ
Is operating margin the same as operating profit margin?
Yes, operating margin and operating profit margin usually refer to the same ratio: operating income divided by revenue. The wording may vary, but the core calculation is the same.
What is a good operating margin?
A good operating margin depends on the industry, business model, peer group, and trend. A fixed threshold can be misleading because normal margin levels differ across sectors.
Why can operating margin differ from net margin?
Operating margin stops at operating income, while net margin uses net income after interest, taxes, and non-operating items. Debt costs, tax rates, and non-operating gains or losses can create a large difference.