Gross margin is a profitability metric that shows the percentage of revenue left after subtracting cost of goods sold, cost of revenue, or other direct costs tied to producing what a company sells.
It is calculated as gross profit divided by revenue, so it isolates the first layer of company profitability before operating expenses, interest, taxes, capital spending, and financing structure enter the analysis.
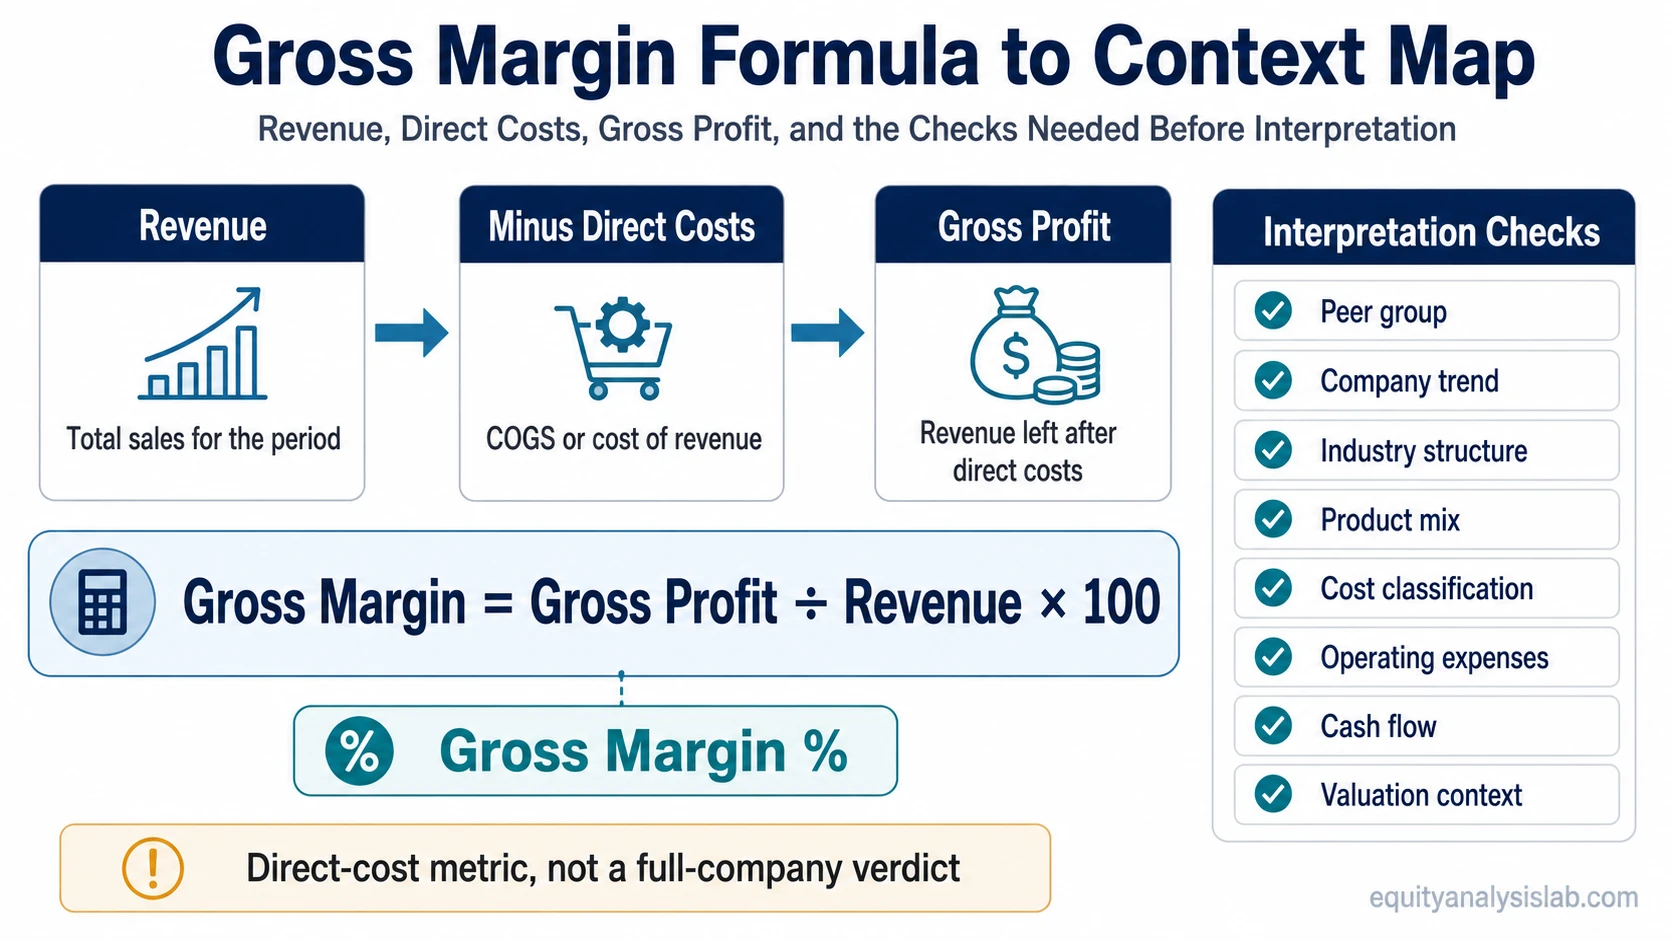
Gross margin answers the direct-cost question, not the full-profitability question. It helps interpret the economics beneath revenue, but it does not decide business quality, valuation, or investment attractiveness by itself.
Definition: Gross margin is gross profit divided by revenue, usually expressed as a percentage. It measures how much revenue remains after the direct costs needed to produce goods or deliver services.
Key Points
- Gross margin measures the share of revenue left after COGS, cost of revenue, or direct production costs.
- The core formula is gross profit divided by revenue, multiplied by 100.
- It is most useful when compared against peers, company history, business model, and cost structure.
- It does not include operating expenses, interest, taxes, cash conversion, or capital intensity.
What Gross Margin Means
Gross margin belongs to the profitability-metric family. It starts from the income statement and focuses on the relationship between revenue and the direct costs required to generate that revenue.
A higher gross margin means a larger share of each revenue dollar remains after direct costs. A lower gross margin means direct costs consume more of each revenue dollar. That difference can reflect business model, product mix, input costs, pricing pressure, accounting classification, or scale economics.
Gross margin explains the first layer of profitability. A company can have strong gross margin and still produce weak net income or weak cash flow if operating expenses, reinvestment needs, debt costs, or working-capital demands absorb the benefit.
Gross Margin Formula
The standard gross margin formula is:
Gross margin = gross profit / revenue × 100
The same formula can also be written as:
Gross margin = (revenue – COGS) / revenue × 100
When a company reports “cost of revenue” instead of COGS, the same concept applies if that line represents the direct cost base tied to the revenue being analyzed. The exact line item can vary by business model and reporting format.
| Formula input | What it means | Interpretation boundary |
|---|---|---|
| Revenue or net sales | Total sales recognized for the period | Revenue growth can still weaken economically if direct costs rise faster. |
| COGS or cost of revenue | Direct costs tied to producing goods or delivering services | Classification can vary, so peer comparisons need accounting context. |
| Gross profit | Revenue minus COGS or direct costs | This is a dollar amount, not the percentage margin. |
| Gross margin percentage | Gross profit as a percentage of revenue | This isolates the direct-cost layer, not total company profitability. |
How to Calculate Gross Margin
A company reports $100 million of revenue and $60 million of COGS. Gross profit is $40 million because $100 million minus $60 million equals $40 million.
Simple calculation: $40 million gross profit divided by $100 million revenue equals 0.40. Multiplying by 100 gives a gross margin of 40%.
A 40% gross margin means the company retains 40 cents of gross profit from each dollar of revenue before operating expenses and other below-gross-profit items. It does not mean the company keeps 40 cents as final profit or cash flow.
The same percentage can have different meanings across industries. A software company, retailer, manufacturer, and commodity producer can have very different direct-cost structures, so the number is most useful when the comparison group is economically similar.
Gross Margin vs Gross Profit, Operating Margin, and Net Margin
Gross margin is often confused with nearby profitability terms. The key difference is where each metric stops in the income-statement structure.
| Metric | What it measures | Main boundary |
|---|---|---|
| Gross profit | Revenue minus COGS or direct costs | Dollar amount before conversion into a percentage |
| Gross margin | Gross profit as a percentage of revenue | Direct-cost profitability only |
| Operating margin | Profitability after operating expenses | Includes the operating expense layer that gross margin leaves out |
| Net margin | Final profit as a percentage of revenue after all expenses | Includes interest, taxes, and other below-operating items |
The distinction matters because a company may have strong direct-cost economics but still spend heavily on sales, research, administration, financing, or taxes. Gross margin identifies the first profitability layer, while later margin layers show how much of that advantage survives further down the income statement.
How Investors Interpret Gross Margin
Gross margin is strongest as a comparison tool. The most useful comparisons usually involve the same company over time, close competitors, similar business models, and industry cost structures.
Trend matters because a stable or rising gross margin can suggest that revenue is not being bought with worsening direct-cost economics. A falling gross margin can suggest input-cost pressure, discounting, unfavorable product mix, weaker pricing power, or lower production efficiency. Those interpretations need support from the notes and the wider financial statements.
Peer context matters because different industries have different economics. A low gross margin can be normal in a high-volume retail model, while a high gross margin can be normal in a software or licensing model. The useful question is whether the percentage fits the business model and remains durable relative to comparable companies.
Gross margin should also be read beside efficiency metrics. Asset turnover ratio helps separate margin economics from revenue-to-assets efficiency, which can change how a business model looks even when gross margin appears attractive.
Interpretation boundary: Gross margin can clarify direct cost economics, but operating expenses, cash flow, capital intensity, balance-sheet risk, and valuation context still decide how much analytical weight the metric deserves.
What Changes the Gross Margin Reading
Several conditions can change the meaning of the same gross margin number:
- Industry structure: Some industries normally operate with lower gross margins because direct costs are high and volume is central to the model.
- Product mix: A shift toward higher-margin or lower-margin products can change the percentage without a broad change in company quality.
- Input costs: Labor, raw materials, shipping, hosting, or production costs can move faster than revenue.
- Accounting classification: Similar costs may be classified differently across companies, which can affect comparability.
- Scale and utilization: Fixed production or service-delivery costs can create margin changes as volume rises or falls.
Revenue growth becomes less useful when the economics beneath revenue are weakening. Sales can rise while gross margin compresses if a company sacrifices direct profitability, accepts weaker mix, or faces cost pressure that has not yet appeared fully in later profit lines.
Limits and Common Mistakes
Common mistake: Treating high gross margin as automatic business quality. High gross margin can be useful, but it does not prove durable demand, efficient spending, strong cash conversion, low capital intensity, or attractive valuation.
Limitation: Gross margin excludes operating expenses, interest, taxes, and many cash-flow timing issues. It can make the direct-cost layer look strong while the full income statement or cash-flow statement tells a more constrained story.
A low gross margin is not automatically a negative sign either. Some business models are built around high volume, inventory turns, or asset efficiency rather than high margin per dollar of revenue. The metric becomes more useful after the business model, peer set, and longer-term trend are clear.
Another mistake is comparing gross margin across companies without checking cost classification. A cost included in COGS for one company may appear in operating expenses for another. That can make one gross margin look stronger even when the underlying economics are closer than the headline number suggests.
Related Metrics
Gross margin answers the direct-cost question. Operating margin, net margin, and asset turnover add later layers by showing how operating expenses, full income-statement costs, and asset efficiency change the overall company-analysis picture.
FAQ
What is gross margin?
Gross margin is gross profit divided by revenue, expressed as a percentage. It shows the share of revenue left after COGS, cost of revenue, or direct production costs.
What is the gross margin formula?
The gross margin formula is gross profit divided by revenue, multiplied by 100. It can also be calculated as revenue minus COGS, divided by revenue, multiplied by 100.
Is gross margin the same as gross profit?
No. Gross profit is a dollar amount. Gross margin is that gross profit amount divided by revenue and shown as a percentage.
What does a 50% gross margin mean?
A 50% gross margin means that 50 cents of gross profit remain from each dollar of revenue before operating expenses, interest, taxes, and other later items.