Company analysis is the structured review of a business before an investor forms or updates a thesis. It organizes evidence from financial statements, earnings, business quality, share structure, operating efficiency, capital returns, and valuation context so the next research step is clear.
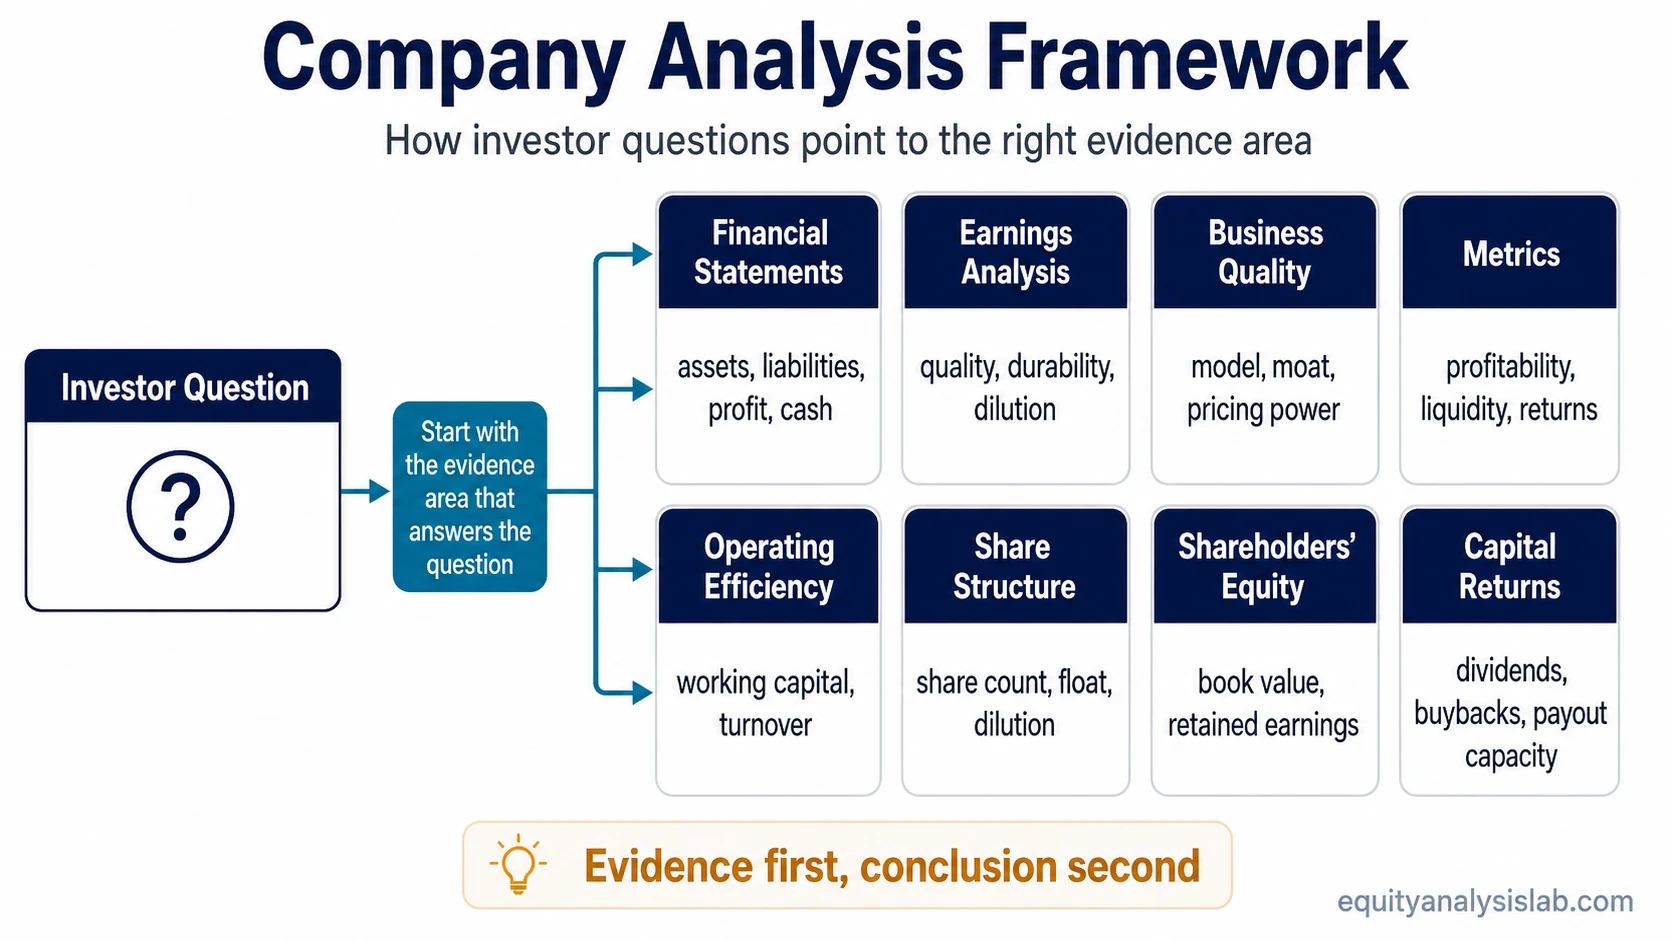
Company analysis works best when each investor question points to the evidence area most likely to answer it. The scope is broad, but the starting point changes depending on whether the question is about liquidity, profit quality, dilution, operating efficiency, capital allocation, or business durability.
Definition: Company analysis is the process of reviewing a business through its financial statements, earnings quality, business model, metrics, share structure, capital allocation, and valuation context so investor reasoning is based on evidence rather than assumption.
What Company Analysis Means for Investors
Company analysis asks a practical question: what evidence explains how a business earns money, protects or loses quality, converts profit into cash, finances itself, allocates capital, and changes shareholder ownership over time?
It is not the same as a stock recommendation, target price, broker workflow, or short-term trading signal. A strong analysis improves the quality of investor reasoning, but it does not remove uncertainty or predict future returns.
Key Points
- Company analysis starts with business evidence, not with a desired conclusion about the stock.
- Financial statements, earnings quality, margins, cash flow, share count, and capital allocation each answer different investor questions.
- The right research path depends on the question being asked: profitability, liquidity, dilution, efficiency, durability, or capital returns.
- A broad company review should identify the right evidence area before turning the research into a thesis, valuation view, or decision checklist.
What Company Analysis Includes
A complete company review usually combines several evidence areas. The goal is not to collect every possible metric, but to identify which evidence changes the interpretation of the business.
| Evidence area | What it helps answer | Best starting point |
|---|---|---|
| Financial statements | How the business reports assets, liabilities, revenue, profit, and cash generation. | financial statements |
| Earnings analysis | Whether reported earnings are meaningful, durable, diluted, or supported by quality evidence. | earnings analysis |
| Business quality | Whether the business model has durability, pricing power, moat characteristics, or concentration risk. | business quality |
| Metrics | How profitability, liquidity, leverage, efficiency, and returns can be compared across time or peers. | company analysis metrics |
| Operating efficiency | How effectively the company turns working capital, inventory, receivables, and payables into operations. | operating efficiency metrics |
| Share structure | Whether ownership is stable, diluted, concentrated, or changing through securities and share-count effects. | share structure |
| Shareholders’ equity | How book value, retained earnings, treasury stock, and equity mechanics shape balance-sheet interpretation. | shareholders’ equity mechanics |
| Capital returns | How dividends, buybacks, payout capacity, and shareholder returns fit the company’s capital allocation record. | capital returns |
Choose the Right Company Analysis Path
The best starting point depends on the investor question. A profit-quality question starts with different evidence than a leverage question, and a dilution question starts with different evidence than a margin question.
| Investor question | Evidence to check first | Why that starting point matters |
|---|---|---|
| Is the company financially stable? | balance sheet | The balance sheet shows assets, liabilities, debt structure, liquidity, and the company’s financial base. |
| Is profit turning into cash? | cash flow statement | Cash-flow evidence helps separate accounting profit from cash generation and reinvestment capacity. |
| Are earnings high quality? | quality of earnings | Earnings quality checks whether reported profit is repeatable, cash-supported, and not driven mainly by one-time effects. |
| Is ownership being diluted? | share dilution | Dilution can reduce each shareholder’s claim even when the business grows. |
| Is the business efficient? | cash conversion cycle | Operating-efficiency metrics show how quickly the business turns operations into cash flow. |
| Does the company have durable quality? | economic moat | Business-quality evidence helps test whether margins, returns, or growth can persist. |
How Financial Statements Fit Into Company Analysis
Financial statements are usually the first evidence layer because they show what the company reports before an investor interprets quality, durability, or valuation. The income statement shows revenue and profit, the balance sheet shows financial position, and the cash flow statement shows how cash moves through the business.
The statements should be read together. A company can report rising profit while cash flow weakens, or it can show strong revenue growth while working capital absorbs cash. The useful question is not whether one statement looks good in isolation, but whether the statements support the same business interpretation.
How Earnings Quality Changes the Interpretation
Earnings analysis focuses on whether profit is meaningful. Reported earnings can be affected by accounting choices, one-time gains, restructuring costs, share count changes, margin pressure, or weak cash conversion.
For investors, earnings quality matters because valuation and thesis work often rely on earnings assumptions. If earnings are not durable or cash-supported, a low multiple or rising EPS figure may be less informative than it appears.
How Business Quality Fits Into the Review
Business quality looks beyond the statements to ask why the company earns what it earns. Pricing power, customer concentration, unit economics, capital allocation, and moat characteristics can explain whether strong results are likely to persist or fade.
This part of company analysis is especially important when two companies have similar financial metrics but different business structures. A high margin may mean durable pricing power in one business and temporary cycle strength in another.
How Metrics Support Company Analysis
Metrics turn financial statements into comparisons. Liquidity ratios, leverage ratios, margin metrics, turnover ratios, and return measures help investors compare a company across time, against peers, or against its own business model.
Metrics should not be treated as final answers. A strong return on equity can come from a high-quality business, but it can also be amplified by leverage or accounting structure. Company analysis uses metrics as evidence, then checks what causes them.
How Share Structure Affects Investor Interpretation
Share structure determines how ownership is divided. Shares outstanding, diluted shares, free float, treasury stock, and dilutive securities can change how investors interpret per-share results.
This matters because a company can grow total earnings while per-share economics improve less than expected. Dilution, buybacks, option grants, and convertible securities all affect the claim that each share has on the business.
Company Analysis Example
Consider a company with rising revenue and improving reported earnings. A surface-level review may treat that as strength. Company analysis asks more questions: did operating cash flow improve, did margins expand for repeatable reasons, did share count increase, did working capital absorb cash, and did the balance sheet become stronger or weaker?
The conclusion may still be positive, negative, or mixed. The value of the process is that the investor knows which evidence changed the interpretation instead of relying on one headline number.
Common Company Analysis Mistakes
| Mistake | Why it weakens the analysis | Better approach |
|---|---|---|
| Starting with valuation only | A cheap-looking stock may still have weak earnings quality, balance-sheet risk, or dilution pressure. | Understand the business evidence before interpreting valuation. |
| Using one metric as the whole answer | Ratios can be distorted by accounting structure, leverage, cyclicality, or one-time effects. | Use metrics as clues, then check the statements and business drivers behind them. |
| Ignoring share count | Per-share results can be weakened by dilution even when total company results improve. | Review basic shares, diluted shares, buybacks, options, and convertible securities. |
| Confusing growth with quality | Growth can create value, destroy value, or hide weak economics depending on margins, cash flow, and capital needs. | Check whether growth improves cash generation, returns, and competitive position. |
Company Analysis Is Not a Stock Recommendation
Company analysis improves the evidence behind investor reasoning, but it does not remove uncertainty. It should not be treated as a prediction, a buy signal, a sell signal, or a target-price formula.
The same company evidence can lead different investors to different conclusions depending on valuation assumptions, portfolio constraints, time horizon, risk tolerance, and required margin of safety.
How to Use This Framework
Use the broad company-analysis framework as a routing tool. Start with the question, identify the evidence category that can answer it, then move into the more specific page or metric that explains the issue in depth.
The process is strongest when the evidence areas are connected rather than isolated. Financial statements show the reported base, earnings analysis checks profit quality, business-quality review tests durability, metrics create comparison, and share-structure review shows how ownership economics may change.
Company Analysis FAQ
Is company analysis the same as valuation?
No. Company analysis studies the business, financial statements, earnings quality, share structure, and operating evidence. Valuation uses some of that evidence to judge price against assumptions about future cash flows, earnings, or comparable companies.
Does company analysis tell investors which stock to buy?
No. Company analysis organizes evidence and highlights risks, strengths, and assumptions. It does not create a buy or sell recommendation by itself.
Where should a beginner start?
A beginner should usually start with financial statements, then move into earnings quality, business quality, metrics, and share structure as the question becomes more specific.