Operating efficiency ratios are company-analysis ratios used to evaluate how efficiently a business uses inventory, receivables, payables, working capital, assets, and operating cash-flow context. They are diagnostic tools, not standalone proof of business quality, valuation quality, cash conversion quality, or investment attractiveness.
The useful starting point is the business question. An inventory-heavy company, a receivables-heavy company, and a supplier-financed company can all show operating efficiency issues, but the relevant ratio family will not be the same.
Key Points
- Operating efficiency ratios evaluate how a company uses inventory, receivables, payables, working capital, and operating cash-flow context.
- They are most useful when compared against peers, company history, business model economics, and accounting policy.
- No single ratio proves company quality, valuation quality, cash conversion, or investment attractiveness.
What Operating Efficiency Ratios Measure
Operating efficiency ratios focus on how operating activity moves through the balance sheet and income statement. They usually connect sales, cost of goods sold, inventory, receivables, payables, working capital, and operating cash flow.
The main question is not whether a ratio is high or low in isolation. The better question is whether the ratio fits the company’s business model, sector norms, recent trend, and cash-flow behavior.
Financial-statement scope: In company analysis, operating efficiency ratios are financial-statement relationships that connect operating activity with inventory, receivables, payables, working capital, assets, revenue, cost of goods sold, and operating cash flow.
Key Operating Efficiency Ratio Groups
Operating efficiency ratios become easier to use when grouped by the question they answer. The table below keeps the focus on financial statement interpretation rather than turning every ratio into a separate formula lesson.
| Business question | Ratio family | What it helps evaluate |
|---|---|---|
| How efficiently does the company move inventory? | Inventory turnover and inventory days | Whether inventory is moving quickly, building up, or tying up working capital. |
| How quickly does the company collect from customers? | Receivables turnover and sales outstanding days | Whether revenue is converting into collections at a reasonable pace. |
| How much supplier financing supports operations? | Payables turnover and payable days | Whether payment timing is normal for the business model or masking working-capital pressure. |
| How long does the operating cycle take? | Operating cycle and cash conversion cycle | How inventory, receivables, and payables combine into timing between outlay and cash recovery. |
| How productive is working capital? | Working capital turnover | How much revenue is supported by the working-capital base. |
| Does accounting profit connect to operating cash flow? | Operating cash-flow coverage | Whether operating activity is supported by cash-flow evidence rather than only accrual accounting. |
Formula-awareness note: Many operating efficiency ratios use average balance sheet values, while some simplified versions use only ending balances. The input choice matters because seasonal or fast-changing companies can look different when average values are used.
Which Operating Efficiency Ratio to Read First
The first ratio should match the source of the operating question. A retailer with rising inventory days and slowing inventory turnover raises a different issue from a software company with rising receivable days. The first case points toward inventory and cash-conversion analysis; the second points toward receivables quality and collection timing.
| Starting question | Start with | Then check |
|---|---|---|
| Inventory appears to be building faster than sales. | Inventory turnover and days inventory outstanding | Gross margin trend, markdown risk, seasonality, and cash conversion. |
| Revenue growth is not clearly becoming cash collection. | Accounts receivable turnover and days sales outstanding | Customer payment terms, receivables quality, revenue recognition, and operating cash flow. |
| Operating cash flow looks strong, but supplier balances are rising. | Accounts payable turnover and days payable outstanding | Supplier-payment stretch, working-capital pressure, and repeatability of the cash-flow benefit. |
| The concern is timing from inventory purchase to cash recovery. | Operating cycle and cash conversion cycle | Inventory days, receivable days, payable days, and business model norms. |
| The question is whether working capital supports revenue efficiently. | Working capital turnover | Revenue mix, balance sheet intensity, credit terms, and capital intensity. |
| The question is whether reported operating performance is cash-backed. | Operating cash flow ratio | Accruals, working-capital movements, seasonality, and one-time timing effects. |
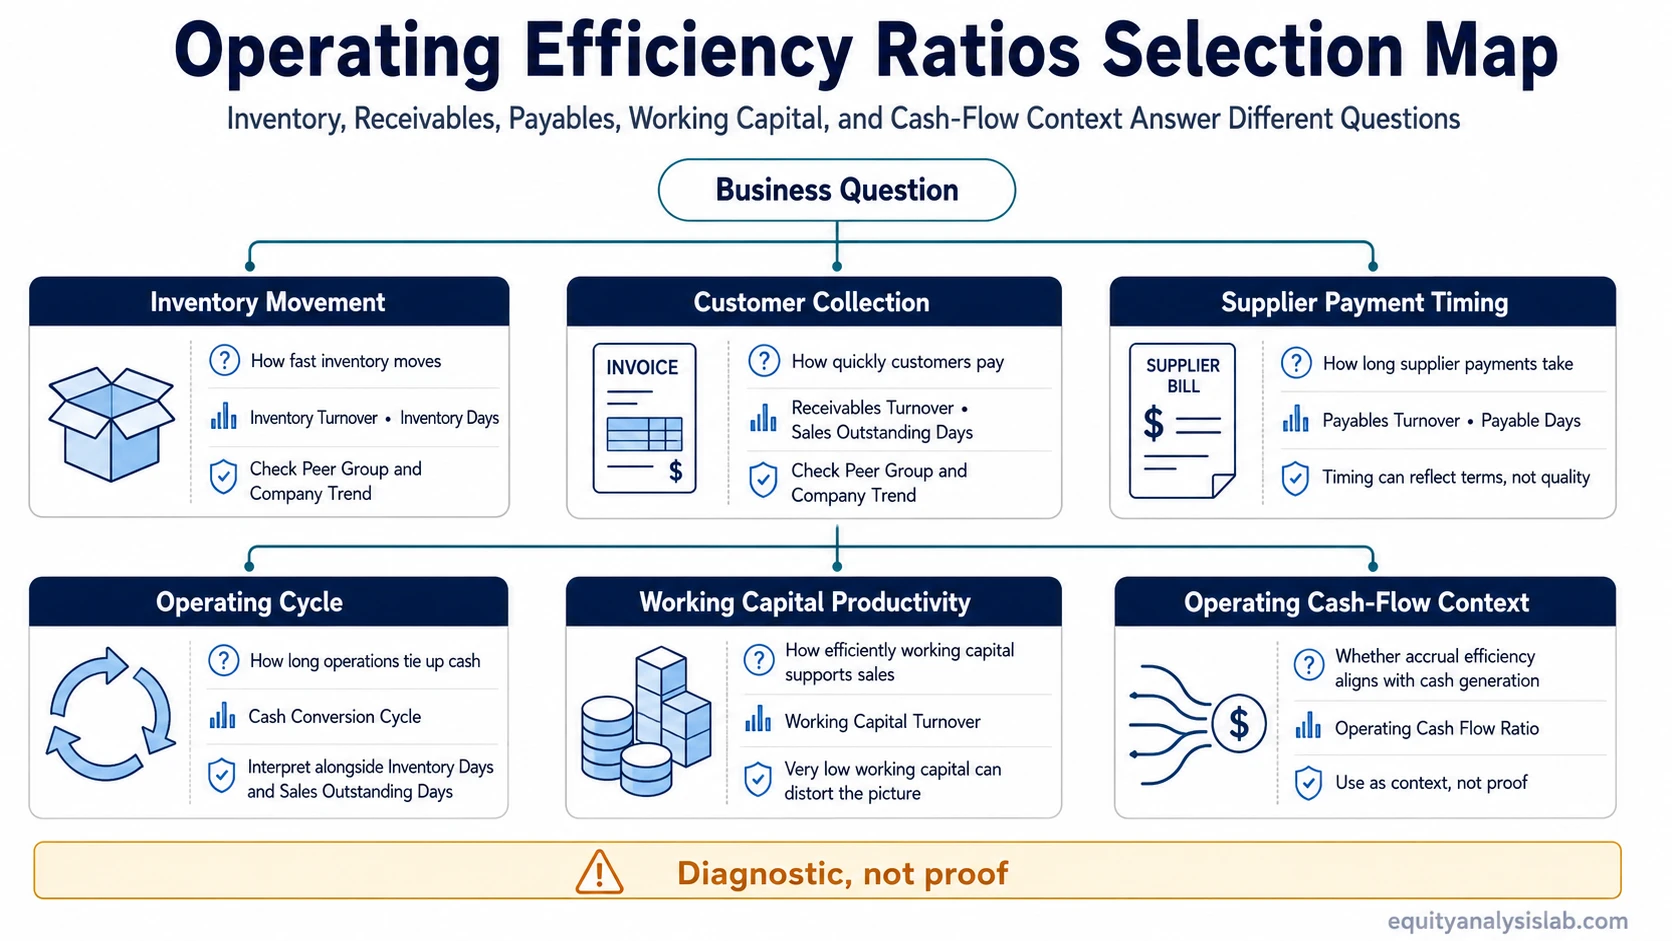
Operating Efficiency Ratios by Question
Each ratio below answers a narrower operating-efficiency question. Start with the ratio family that matches the company’s actual operating issue before moving into detailed interpretation.
| Question | Primary ratio | Use it to examine |
|---|---|---|
| How fast is inventory moving? | inventory turnover ratio | Inventory movement relative to cost of goods sold. |
| How many days inventory stays before sale? | days inventory outstanding | Inventory holding period and potential working-capital drag. |
| How fast are receivables collected? | accounts receivable turnover ratio | Customer collection efficiency relative to credit sales or revenue. |
| How many days sales remain uncollected? | days sales outstanding | Receivable collection timing and revenue-to-cash conversion. |
| How quickly does the company pay suppliers? | accounts payable turnover ratio | Supplier payment pace relative to cost of goods sold or purchases. |
| How long does the company take to pay suppliers? | days payable outstanding | Supplier financing, payment stretch, and working-capital timing. |
| How long is the full operating cycle? | operating cycle timing | The time between inventory investment and customer collection. |
| How long is cash tied up after supplier payments? | cash conversion cycle timing | The net timing gap after inventory, receivables, and payables are combined. |
| How much revenue is produced by working capital? | working capital turnover ratio | Revenue productivity relative to the working-capital base. |
| Does operating activity have cash-flow support? | operating cash flow ratio | Whether operating cash flow supports current operating obligations. |
How to Interpret Operating Efficiency Ratios Safely
Operating efficiency ratios become more useful when the analyst separates measurement from interpretation. A ratio may improve because operations are genuinely more efficient, but it may also change because of seasonality, accounting policy, customer mix, supplier terms, product mix, inflation, acquisitions, or temporary working-capital movements.
Use a sequence: compare the ratio against the company’s own history, compare it against appropriate peers, check the related cash-flow movement, and then ask whether the change fits the business model.
A shorter cash conversion cycle can be useful for some businesses, but it is not automatically a sign of quality. If the improvement comes mainly from stretching suppliers, it may be less durable than an improvement caused by faster inventory movement or faster customer collection.
Limits of Operating Efficiency Ratios
Operating efficiency ratios can reveal useful questions, but they do not answer every investment question. They do not measure valuation, competitive advantage, management quality, future returns, or whether a stock is attractive at its current price.
Main limitation: Operating efficiency ratios are diagnostic indicators. They help identify where to investigate inventory, receivables, payables, working capital, and cash-flow timing, but they are not final conclusions about business quality or investment merit.
Industry context matters. A grocery retailer, industrial distributor, software company, manufacturer, and marketplace platform can all require different efficiency benchmarks because their inventory needs, payment terms, credit exposure, and cash-collection cycles differ.
Common Mistakes With Operating Efficiency Ratios
Mistake 1: Treating a high or low ratio as good or bad without peer context.
Mistake 2: Reading one ratio while ignoring the related inventory, receivable, payable, and cash-flow movement.
Mistake 3: Comparing companies with very different business models as if they should have the same working-capital structure.
Mistake 4: Treating a temporary working-capital change as a permanent efficiency improvement.
FAQ
What are operating efficiency ratios?
Operating efficiency ratios are financial-statement ratios used to evaluate how efficiently a company uses inventory, receivables, payables, working capital, assets, and operating cash-flow context.
Which operating efficiency ratio is most important?
There is no single most important ratio for every company. Inventory-heavy businesses often require inventory and cash-conversion analysis, while receivables-heavy businesses may require collection and credit-quality analysis first.
Can operating efficiency ratios show whether a company is a good investment?
No. They can help identify operating strengths, weaknesses, and working-capital questions, but investment analysis also requires valuation, earnings quality, cash flow, balance sheet risk, competitive position, and portfolio context.
Why should operating efficiency ratios be compared by industry?
Industry comparison matters because inventory intensity, payment terms, cash-collection cycles, supplier relationships, and capital needs differ across business models. A normal ratio in one sector may be unusual in another.