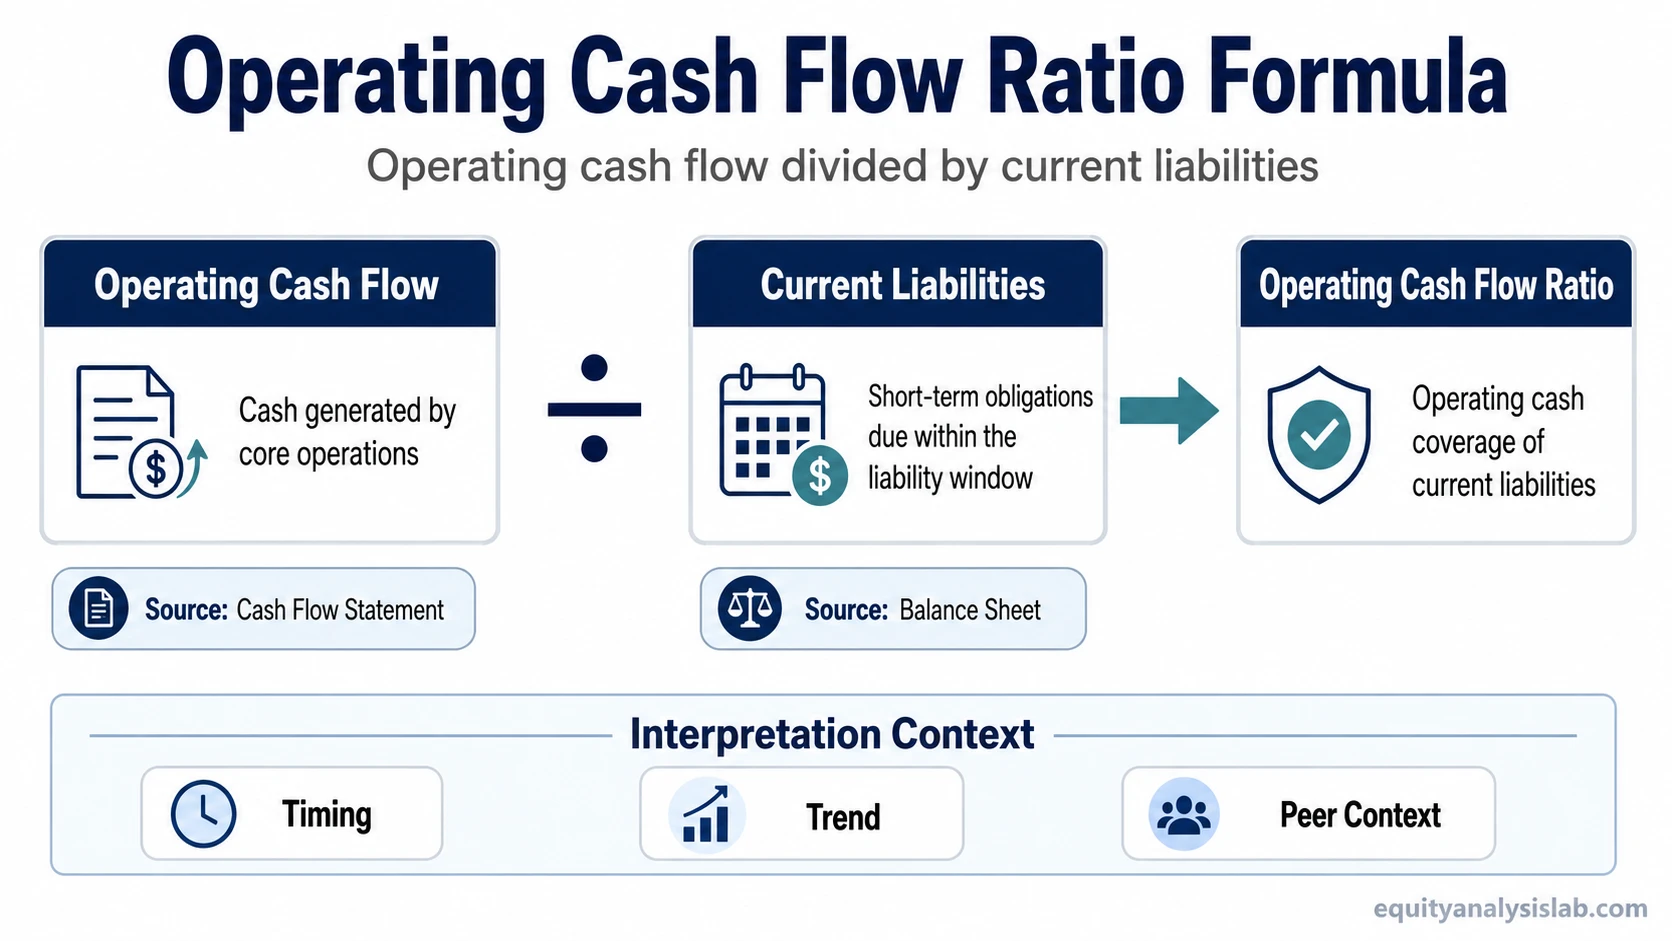
Operating cash flow ratio compares cash generated from operating activities with current liabilities. Operating cash flow comes from the cash flow statement, current liabilities come from the balance sheet, and the result measures how much short-term obligation coverage is supported by operating cash rather than accounting profit or noncash assets.
Definition: Operating cash flow ratio is a liquidity and cash-coverage ratio calculated as operating cash flow divided by current liabilities. It helps investors evaluate whether a company’s normal operations are producing enough cash to cover obligations due within the next year, but it does not prove business quality by itself.
Key Points
- Operating cash flow ratio measures operating cash coverage of current liabilities.
- The formula is operating cash flow divided by current liabilities.
- Operating cash flow is taken from the cash flow statement, while current liabilities are taken from the balance sheet.
- A ratio above 1 can suggest stronger cash coverage, but it still needs trend, peer, seasonality, and working-capital context.
- A low ratio is not automatically negative if timing effects, industry norms, or temporary working-capital movements explain the result.
Operating Cash Flow Ratio Formula
The operating cash flow ratio formula is:
Operating Cash Flow Ratio = Operating Cash Flow / Current Liabilities
Operating cash flow represents cash generated by the company’s core operating activities during the period. Current liabilities represent obligations expected to be settled within one year or the operating cycle, such as accounts payable, accrued expenses, short-term borrowings, and the current portion of long-term debt.
The ratio is usually read as a coverage measure. A result of 1.0 means operating cash flow equals current liabilities for the period being measured. A result of 0.5 means operating cash flow covers half of current liabilities. A result of 2.0 means operating cash flow is twice current liabilities before considering timing, seasonality, debt maturity structure, and working-capital changes.
Formula Inputs and Financial Statement Sources
The ratio is useful only when the two inputs are taken from the correct financial statements and interpreted in the same reporting context.
| Input | Financial statement source | What it tells the investor | Limitation |
|---|---|---|---|
| Operating cash flow | Cash flow statement | Shows cash generated or used by core operating activities during the period. | Can be affected by working-capital timing, one-period collections, supplier payments, and seasonality. |
| Current liabilities | Balance sheet | Shows obligations due within the short-term liability window. | Does not show the exact timing of each payment inside the period. |
| Operating cash flow ratio | Calculated from both statements | Compares operating cash generation with short-term obligations. | Needs trend, peer, debt maturity, and business-model context before drawing conclusions. |
This statement-source split is the main reason the ratio can be more cash-focused than accrual-based liquidity ratios. It compares a cash flow statement measure with a balance sheet obligation base rather than comparing only balance sheet assets and liabilities.
How Investors Interpret Operating Cash Flow Ratio
A higher operating cash flow ratio can indicate that a company is generating more cash from operations relative to short-term obligations. Operating cash flow can provide a more cash-focused liquidity view than net income alone because it reflects cash generated or used by operating activities.
A ratio above 1 is often a starting sign of stronger operating cash coverage, but it is not automatically good. Collections may have been unusually high, inventory may have been reduced, suppliers may have been paid later, or working capital may have temporarily moved in the company’s favor.
A ratio below 1 is often a starting sign that operating cash flow did not fully cover current liabilities during the period, but it is not automatically bad. Seasonal businesses, inventory-heavy companies, expanding companies, and firms with uneven billing cycles can show weaker one-period coverage even when the broader financial position is stable.
Trend context matters more than a single reading. A stable or improving ratio over several periods can suggest improving cash conversion, while a declining ratio can point to weaker collections, higher short-term obligations, margin pressure, or less favorable working-capital movement.
Peer context also matters. Companies with different business models can carry different normal levels of current liabilities, inventory, receivables, deferred revenue, and supplier financing. Comparing the ratio across similar companies is usually more useful than applying one universal threshold.
Short Calculation Example
Illustrative example: Suppose a company reports $120 million of operating cash flow and $80 million of current liabilities.
Calculation: $120 million / $80 million = 1.5
Interpretation: The company generated operating cash flow equal to 1.5 times current liabilities during the period. That suggests operating cash covered short-term obligations in this simplified example, but the result still needs timing, seasonality, working-capital, and peer comparison before it can support a stronger liquidity judgment.
This example is hypothetical. It does not describe a real company, a historical case, or an investment conclusion.
Operating Cash Flow Ratio vs Current Ratio
Operating cash flow ratio and current ratio both relate to short-term liquidity, but they answer different questions. Operating cash flow ratio asks whether operations produced enough cash relative to current liabilities. Current ratio compares current assets with current liabilities at a balance sheet date.
| Metric | Formula | Main question | Main limitation |
|---|---|---|---|
| Operating cash flow ratio | Operating cash flow / Current liabilities | Are normal operations producing cash coverage for short-term obligations? | Can be distorted by one-period working-capital timing. |
| Current ratio | Current assets / Current liabilities | Do current assets exceed current liabilities at the balance sheet date? | Current assets may include inventory or receivables that are not immediately cash-like. |
The useful distinction is cash flow versus balance sheet stock. Operating cash flow ratio focuses on cash produced during a period. Current ratio focuses on the asset base available at a point in time.
Common Mistakes When Using Operating Cash Flow Ratio
Mistake 1: Treating above 1 as automatically safe. A ratio above 1 can look strong, but it may reflect short-term timing effects rather than durable cash-generation strength.
Mistake 2: Treating below 1 as automatically weak. A ratio below 1 can be a warning sign, but seasonal cash flows, growth investment, billing cycles, and industry structure may explain the result.
Mistake 3: Ignoring the balance sheet date. Current liabilities are measured at a point in time. Operating cash flow is measured over a period. A mismatch between timing and obligation maturity can change the interpretation.
Mistake 4: Confusing cash coverage with business quality. The ratio can support liquidity analysis, but it does not prove competitive advantage, earnings durability, pricing power, or valuation attractiveness.
Limitations of Operating Cash Flow Ratio
Working-capital timing can distort the ratio. Faster collections, slower supplier payments, inventory reductions, or changes in accrued expenses can improve operating cash flow without reflecting a permanent improvement in the business.
One period is not enough. A single quarter or year can be affected by seasonality, payment timing, restructuring, tax payments, or temporary changes in demand.
Industry structure changes the benchmark. Retailers, software companies, manufacturers, distributors, and capital-intensive businesses can have very different normal working-capital patterns.
The ratio does not replace debt analysis. Current liabilities show short-term obligations, but debt maturity schedules, refinancing risk, interest burden, and covenant pressure may require separate review.
The ratio becomes more useful when it is read alongside margins, revenue quality, working-capital movement, debt structure, and other operating-efficiency metrics rather than treated as a standalone score.
Cash Conversion and Operating Efficiency Context
Operating cash flow ratio connects naturally to cash conversion because short-term liquidity often depends on how quickly sales become cash, how long inventory stays unsold, and how supplier payments are managed. A company may report acceptable profits while operating cash flow weakens if receivables rise, inventory builds, or cash collection slows.
The operating cycle helps frame that timing. A longer cycle can increase the gap between reported sales and cash collection, while a shorter cycle can support faster conversion of activity into cash.
Related Operating-Efficiency Metrics
Accounts receivable turnover ratio: Accounts receivable turnover ratio helps investors evaluate how efficiently a company collects receivables after sales are recorded.
Accounts payable turnover ratio: Accounts payable turnover ratio helps investors evaluate how quickly a company pays suppliers relative to purchases or cost activity.
Operating cycle: Operating cycle connects inventory movement, receivable collection, and the time required to turn operating activity into cash.
FAQ
What is a good operating cash flow ratio?
A higher operating cash flow ratio can suggest stronger operating cash coverage, but there is no universal good number. Investors should compare the ratio with the company’s own history, similar peers, business model, seasonality, and working-capital pattern.
Can operating cash flow ratio be misleading?
Yes. Operating cash flow ratio can be misleading when one-period working-capital changes, unusual collections, delayed supplier payments, seasonality, or short-term liability timing distort the relationship between operating cash flow and current liabilities.