Stock analysis metrics are financial ratios and measures used to read a company’s profitability, financial strength, efficiency, cash generation, and valuation context. They help investors organize company analysis, but they do not decide on their own whether a stock is attractive.
A useful metrics process starts with the question being asked. Profitability metrics answer a different question from liquidity metrics. Leverage metrics answer a different question from operating efficiency metrics. Valuation metrics only become meaningful after the business, balance sheet, earnings quality, and peer context are understood.
Key points about stock analysis metrics
- Stock analysis metrics turn financial statement data into comparable signals about a business.
- No single ratio gives a complete view of company quality, valuation, or investment risk.
- The same metric can mean different things depending on industry, accounting base, period, and peer set.
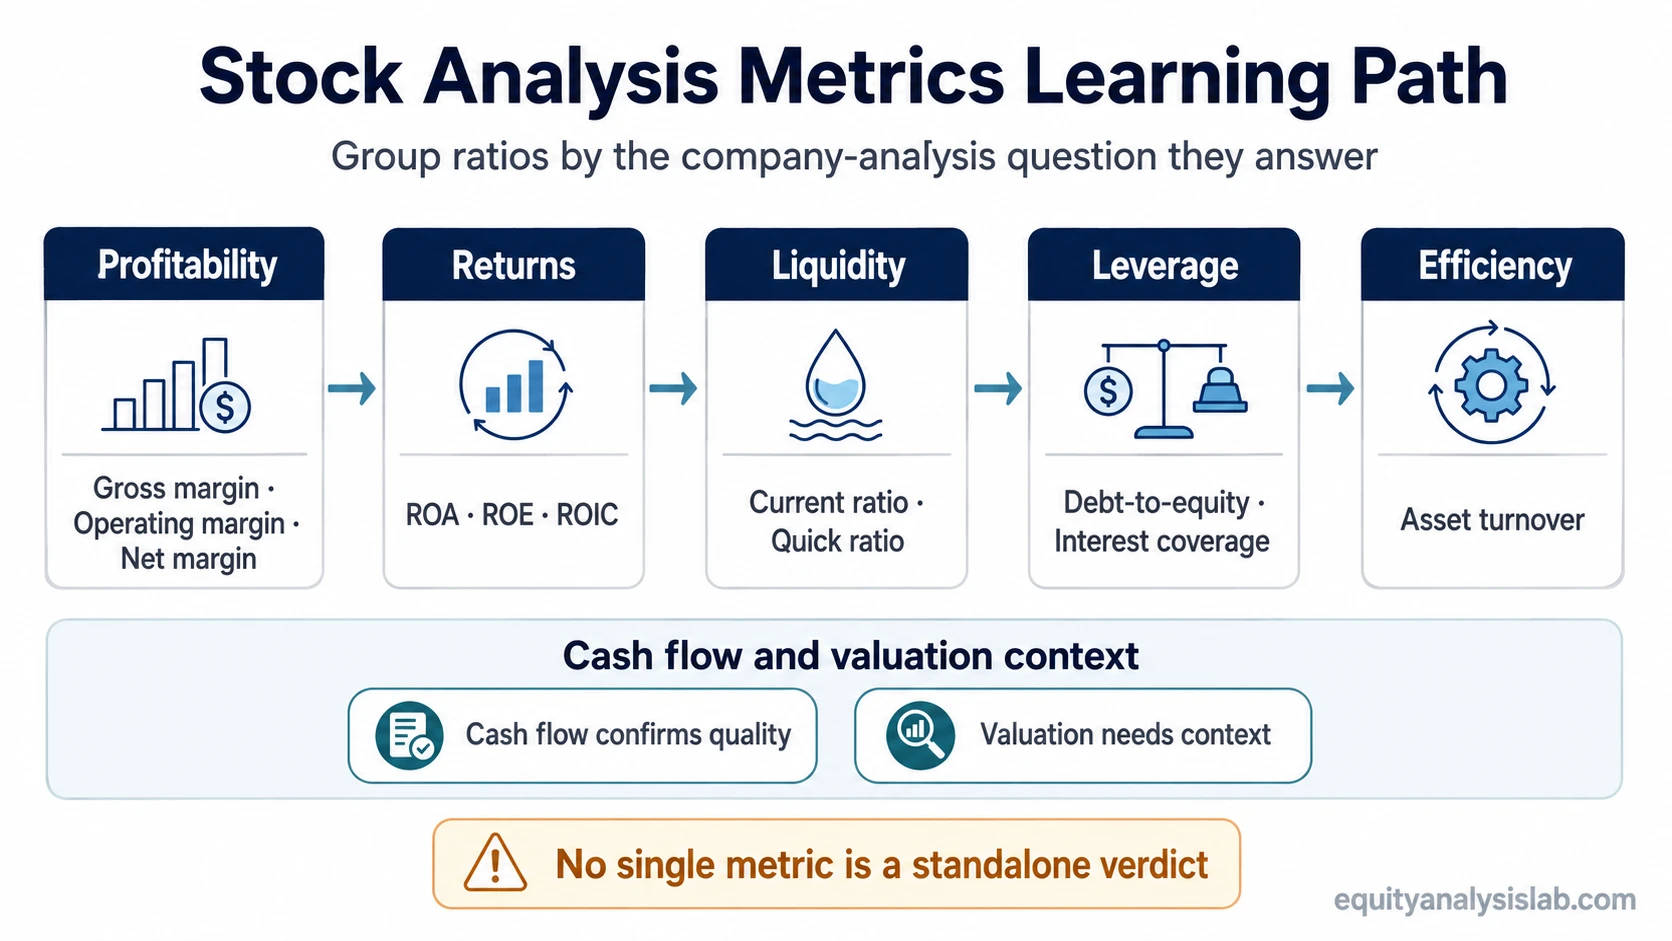
- Profitability, liquidity, leverage, efficiency, cash flow, and valuation metrics answer different analytical questions.
- The strongest reading usually comes from combining metric families instead of treating one number as a verdict.
What stock analysis metrics are
Stock analysis metrics are ratios and financial measures used to evaluate how a company earns money, uses assets, manages obligations, converts activity into cash, and compares with similar businesses.
The word “stock” can make metrics sound market-focused, but most useful stock analysis metrics begin with the company. A share price may reflect expectations, sentiment, and market conditions, while the underlying metrics help read the business that the share represents.
That distinction matters because a metric is not a recommendation. A high margin, low debt ratio, or strong return figure may be useful, but each still needs context. The numerator, denominator, accounting period, business model, and peer group can all change the interpretation.
Metric families for company analysis
The first step is to separate metrics by analytical job. A profitability ratio should not be used to answer a liquidity question. A leverage ratio should not be treated as a valuation signal. A valuation multiple should not replace the work of understanding business quality.
| Metric family | Primary question | Examples to study | Main caution |
|---|---|---|---|
| Profitability | How much profit does the business keep from revenue? | Gross margin, operating margin, net margin | Margins need industry and business-model context. |
| Returns | How effectively does the company turn capital or assets into profit? | Return on assets, return on equity, return on invested capital | Returns can be distorted by leverage, asset intensity, or accounting structure. |
| Liquidity | Can the company cover near-term obligations with near-term resources? | Current ratio, quick ratio | Inventory, receivables, and working-capital timing can change the reading. |
| Leverage and solvency | How much balance-sheet risk does the company carry? | Debt-to-equity ratio, interest coverage ratio | Debt capacity depends on cash flow stability, cyclicality, and rate sensitivity. |
| Efficiency | How productively does the company use its asset base? | Asset turnover ratio | Asset-light and asset-heavy companies can look very different even when both are healthy. |
| Cash flow and operating performance | Does reported performance translate into cash generation? | Operating cash flow, free cash flow, operating cash flow ratio | Cash flow can shift with working capital, capital expenditure, and business cycle timing. |
| Valuation | What price is the market assigning to earnings, assets, sales, or cash flow? | P/E, EV/EBITDA, price-to-sales, price-to-book, free-cash-flow yield | Valuation multiples are not meaningful without growth, risk, quality, and peer context. |
Which metric should you read first?
The best starting metric depends on the analytical question. A profitable company, a financially resilient company, an efficient company, and a statistically cheap company are not the same idea.
| Analytical question | Start with | Then compare with |
|---|---|---|
| Is the company profitable? | Gross margin, operating margin, net margin | Return on assets, return on equity, return on invested capital |
| Is profitability efficient or capital-heavy? | Return on invested capital | Return on equity, return on assets, asset turnover |
| Can the company handle near-term obligations? | Current ratio and quick ratio | Current ratio vs quick ratio |
| Is debt becoming a risk? | Debt-to-equity ratio | Interest coverage ratio and cash-flow consistency |
| Is the company using assets effectively? | Asset turnover ratio | Margins and return metrics |
| Are shareholder returns high quality? | ROE and ROIC together | ROE vs ROIC |
| Does the market price look reasonable? | Valuation multiples | Growth, margins, returns, balance-sheet risk, and cash-flow quality |
This sequence prevents a common mistake: starting with the metric that is easiest to find instead of the metric that answers the question. A low valuation multiple can look attractive until weak margins, falling returns, poor cash conversion, or balance-sheet pressure explain why the multiple is low.
How financial statements shape metric interpretation
Most stock analysis metrics come from the income statement, balance sheet, cash-flow statement, or a combination of them. Knowing the source helps prevent false comparisons.
| Financial statement source | What it usually supports | Examples | Interpretation issue |
|---|---|---|---|
| Income statement | Profitability, margins, earnings trend | Gross margin, operating margin, net margin, EPS-related metrics | Accounting profit may not equal cash generation. |
| Balance sheet | Liquidity, leverage, asset base, equity base | Current ratio, quick ratio, debt-to-equity ratio, ROA, ROE | Point-in-time balances can move with seasonality or one-off events. |
| Cash-flow statement | Cash generation and quality confirmation | Operating cash flow, free cash flow, cash-flow coverage measures | Working-capital changes and capital expenditures can change the picture. |
| Market price plus financial data | Valuation context | P/E, EV/EBITDA, price-to-sales, price-to-book | Market expectations can change faster than reported financials. |
A ratio is often a bridge between statements. Return on assets connects earnings to the asset base. Return on equity connects profit to shareholder equity. Debt-to-equity connects obligations to capitalization. These bridges are useful only when the accounting base is understood.
Why the same metric can mean different things
A high current ratio may look conservative for one company and inefficient for another. A business with large inventory needs may naturally hold more current assets, while a software company with recurring revenue may operate with a different working-capital structure. The ratio is the starting point; the business model explains why the number looks the way it does.
The same logic applies to margins and returns. A retailer, bank, software company, and industrial manufacturer can have very different normal ranges. Comparing a company to the wrong peer set can make a normal metric look unusually strong or unusually weak.
A metric becomes more useful when the peer group, accounting period, statement source, and business model all match the question being asked.
Why one metric is not enough
No single stock analysis metric should be treated as a complete verdict. A company can have strong margins and weak cash conversion. It can have high return on equity because leverage is high. It can have a low valuation multiple because growth is slowing or financial risk is rising.
Metric interpretation becomes stronger when several questions point in the same direction:
- Do margins show real profitability?
- Do return metrics show productive use of capital?
- Do liquidity ratios show near-term resilience?
- Do leverage metrics show manageable obligations?
- Does cash flow confirm reported profit?
- Does valuation make sense relative to growth, quality, and risk?
The practical mistake is treating a ratio as a shortcut. Metrics are evidence inputs. They still need judgment, comparison, and context.
Common mistakes when reading company metrics
| Mistake | Why it misleads | Better approach |
|---|---|---|
| Comparing ratios across unrelated industries | Different business models have different normal margin, asset, and leverage structures. | Compare against close peers and the company’s own history. |
| Reading a high ROE as automatically strong | ROE can rise because of leverage or a reduced equity base. | Read ROE together with ROIC, ROA, leverage, and cash flow. |
| Treating liquidity ratios as a full solvency test | Current assets may not convert to cash cleanly or quickly. | Check quick assets, working-capital quality, debt maturity, and cash generation. |
| Using valuation multiples before understanding the business | A low multiple may reflect real risk, weak growth, cyclicality, or deteriorating quality. | Analyze profitability, returns, balance-sheet risk, and cash flow before valuation. |
| Ignoring the period used in the ratio | Trailing, forward, quarterly, and annual data can show different pictures. | Match the period to the question and watch for one-off effects. |
How to use the metrics learning path
Start with the metric family that matches the question, then move into the specific ratio that carries the cleanest signal for that question.
| Start here | Use when the question is about | Next metric pages |
|---|---|---|
| Profitability | How much of revenue becomes profit at different levels of the income statement | gross margin, operating margin, net margin |
| Returns | How efficiently the company earns against assets, equity, or invested capital | return on assets, return on equity, return on invested capital |
| Liquidity | Whether near-term assets appear sufficient against near-term liabilities | current ratio, quick ratio, current ratio vs quick ratio |
| Leverage | How much financial obligation the company carries and whether interest cost is covered | debt-to-equity ratio, interest coverage ratio |
| Efficiency | How productively the company uses its asset base | asset turnover ratio |
| Return quality comparison | Whether high shareholder returns reflect durable capital efficiency or accounting/leverage effects | ROE vs ROIC |
Stock analysis metrics FAQ
What are the main stock analysis metrics?
The main stock analysis metrics include profitability margins, return ratios, liquidity ratios, leverage ratios, efficiency ratios, cash-flow measures, and valuation multiples. Each family answers a different company-analysis question.
Is one metric enough to analyze a stock?
No. One metric can highlight a useful signal, but it cannot capture profitability, financial strength, cash flow, valuation, and business quality at the same time. Strong analysis compares multiple metrics in context.
Should valuation ratios be compared across industries?
Valuation ratios are most useful when compared with similar companies, similar business models, and similar growth and risk profiles. Cross-industry comparisons can be misleading because margins, capital intensity, cyclicality, and balance-sheet structures differ.