Debt to equity ratio compares a company’s liabilities with shareholders’ equity. It is a balance-sheet leverage metric that helps investors see how much financing comes from obligations versus owner capital.
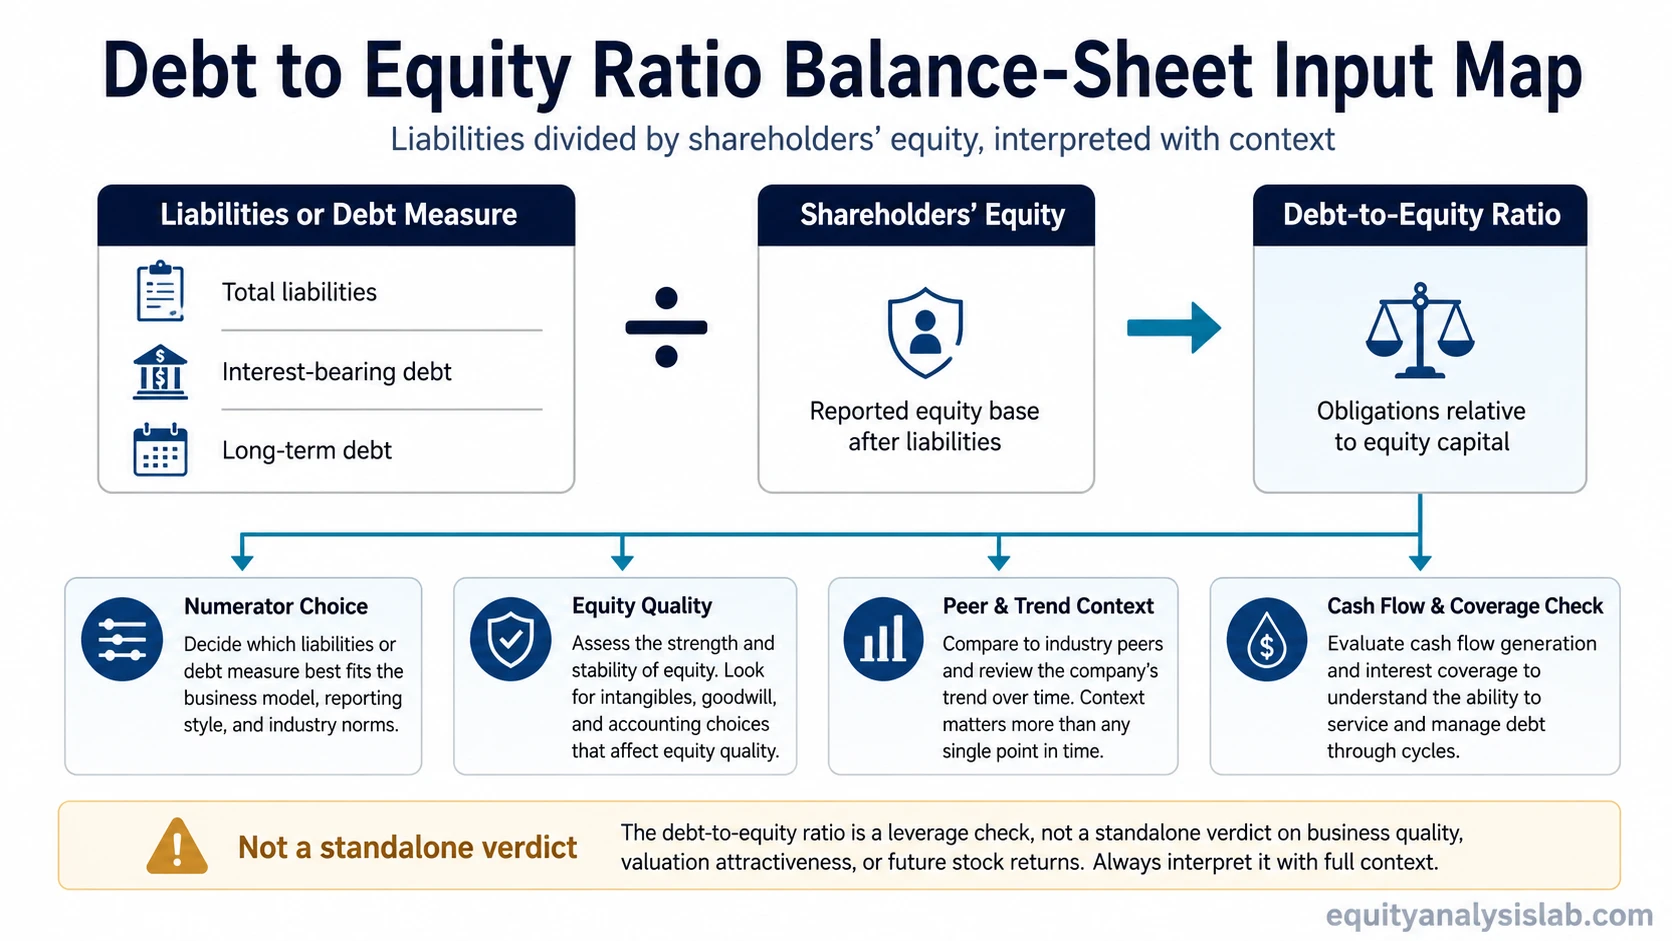
Definition: The debt to equity ratio divides a selected liability or debt measure by shareholders’ equity. The broad balance-sheet version uses total liabilities; narrower versions may use interest-bearing debt or long-term debt when the analysis is focused on financing debt.
The basic formula is:
Debt-to-equity ratio = total liabilities ÷ shareholders’ equity
A higher ratio can point to heavier balance-sheet leverage, while a lower ratio can point to more equity-funded financing. The number is not a standalone verdict on business quality, valuation, or future stock returns. Its meaning changes with industry norms, capital intensity, equity quality, debt maturity, and cash-flow capacity.
Key Points
- Debt to equity ratio compares balance-sheet obligations with shareholders’ equity.
- The common formula is total liabilities divided by shareholders’ equity, but narrower debt definitions may be used for specific analysis.
- High, low, or negative readings need peer, trend, and business-model context.
- The ratio measures leverage, not short-term liquidity or debt-service capacity.
- Cash flow, interest burden, maturity schedule, and equity quality should be reviewed before drawing conclusions.
Debt to Equity Ratio Formula
The standard formula uses two balance-sheet inputs: total liabilities and total shareholders’ equity. Total liabilities appear on the liabilities side of the balance sheet. Shareholders’ equity appears in the equity section, usually after liabilities.
| Input | Where it appears | What it represents | Why it can affect interpretation |
|---|---|---|---|
| Total liabilities | Balance sheet liabilities section | Obligations owed to lenders, suppliers, employees, governments, or other parties | Includes more than interest-bearing debt, so it can make the ratio broader than a pure debt measure |
| Shareholders’ equity | Balance sheet equity section | Residual ownership value after liabilities are subtracted from assets | A small, negative, or accounting-distorted equity base can make the ratio look extreme even when the debt number has not changed much |
| Debt-to-equity result | Calculated from the two inputs | Liabilities or debt relative to equity capital | Needs comparison against peers, history, cash flow, and the company’s financing model |
For example, a company with $600 million of total liabilities and $300 million of shareholders’ equity has a debt to equity ratio of 2.0. That means liabilities are two times the equity base under the total-liabilities version of the calculation.
Which Debt Number Should Be Used?
The numerator should match the analysis question. Total liabilities give a broad view of obligation load. Interest-bearing debt gives a narrower view of borrowings that usually create explicit interest cost. Long-term debt focuses on financing structure beyond near-term obligations.
| Numerator choice | Best use | Main caution |
|---|---|---|
| Total liabilities | Broad balance-sheet leverage check | May include operating liabilities that are not financial debt |
| Interest-bearing debt | Debt-funded capital structure analysis | May exclude important obligations that still affect risk |
| Long-term debt | Longer-duration financing review | May understate near-term debt pressure if current borrowings are meaningful |
| Debt plus preferred stock or hybrid financing | More conservative capital-structure review | Treatment depends on the instrument’s economic features and accounting classification |
Consistency matters. Comparing a total-liabilities ratio for one company with an interest-bearing-debt ratio for another can create a false difference. The same definition should be used across peers unless there is a clear reason to adjust it.
How to Interpret Debt to Equity Ratio
Debt to equity ratio is most useful as a comparison tool. A single reading is less informative than the same ratio compared with the company’s own history, close peers, industry norms, and cash-flow profile.
| Ratio pattern | Possible meaning | What to review next |
|---|---|---|
| Higher than peers | The company may rely more heavily on liabilities or debt financing | Interest burden, maturity schedule, operating cash flow, and whether the business model supports leverage |
| Lower than peers | The company may use less debt financing or retain a larger equity cushion | Whether the company is conservatively financed, asset-light, underleveraged, or less profitable |
| Rising over time | Leverage may be increasing because of new borrowing, falling equity, losses, buybacks, or acquisitions | Whether the trend comes from debt growth, equity shrinkage, or both |
| Falling over time | Leverage may be declining because of repayment, retained earnings, equity issuance, or asset sales | Whether the decline reflects improved financial strength, dilution, or asset reduction |
| Negative ratio | Shareholders’ equity is negative, usually because liabilities exceed assets or accumulated losses have reduced equity | The cause of negative equity before treating the ratio as comparable with normal positive-equity companies |
Capital-intensive businesses often operate with different leverage norms from asset-light businesses. Capital intensity, regulation, asset base, and earnings stability can make normal leverage ranges very different across sectors.
Two companies can show the same debt to equity ratio while carrying different balance-sheet risk if one has durable cash flow and long maturities while the other has weaker coverage and near-term refinancing pressure.
Simple Debt to Equity Ratio Example
Example: A company reports $900 million of total liabilities and $450 million of shareholders’ equity. Using the total-liabilities version, the debt to equity ratio is 2.0.
Calculation: $900 million ÷ $450 million = 2.0
A 2.0 reading means liabilities are twice the reported equity base. The calculation is only the starting point; peer norms, trend direction, cash-flow durability, and equity quality determine how useful the reading is.
What Debt to Equity Ratio Cannot Prove by Itself
Limitation: Debt to equity ratio measures balance-sheet leverage, not debt-service ability. A company can have a moderate ratio and still struggle if cash flow is weak or interest costs rise. A company can also have a higher ratio that remains manageable if cash flows are durable and maturities are well spaced.
The ratio does not measure short-term liquidity. A leverage ratio can look acceptable while near-term working-capital pressure is building. The current ratio is a better starting point for comparing current assets with current liabilities.
The ratio also does not show whether interest expense is comfortably covered by profit. A debt-service review should include an interest coverage ratio check alongside cash-flow analysis.
Leverage is separate from operating efficiency. A company can use debt heavily and still produce weak sales from its asset base. The asset turnover ratio helps separate capital-use efficiency from financing structure.
Statement Input to Interpretation Framework
A debt to equity reading is more useful when the calculation and cross-checks are kept separate. The input choice, the ratio result, and the next financial-statement checks each answer a different question.
| Step | Question | Reason |
|---|---|---|
| Statement input | Which liabilities or debt number is being used? | The numerator can change materially depending on whether total liabilities, interest-bearing debt, or long-term debt is selected |
| Ratio | What is the calculated debt to equity ratio? | The result shows the size of obligations relative to reported equity |
| Interpretation | How does the ratio compare with peers and the company’s own trend? | Industry norms and business models change what high or low leverage means |
| Cross-check | Can cash flow and earnings support the obligation load? | Debt size matters less without evidence about serviceability, maturity timing, and resilience |
Common Mistakes When Reading Debt to Equity Ratio
Common mistake: Treating a high ratio as automatically bad or a low ratio as automatically good. A high ratio can be normal for a stable, asset-heavy business with durable cash flow. A low ratio can reflect conservative financing, but it can also reflect limited reinvestment opportunities or recent equity issuance.
Another mistake is ignoring the denominator. Shareholders’ equity can fall because of losses, large buybacks, impairments, accumulated deficits, or accounting structure. When equity is unusually small or negative, the ratio can become extreme even before new debt is added.
Peer comparison should also be narrow. Comparing leverage across unrelated industries can create false comfort or false alarm. A better comparison uses companies with similar business models, asset intensity, profitability, and financing needs.
Related Metrics That Complete the Leverage Picture
Debt to equity ratio is strongest when it is paired with metrics that answer different financial-statement questions. Leverage, liquidity, debt service, and efficiency belong to separate checks.
| Metric | Main question | Boundary against debt to equity ratio |
|---|---|---|
| Current ratio | Can current assets cover current liabilities? | Liquidity check, not capital-structure leverage |
| Interest coverage ratio | How comfortably can operating profit cover interest expense? | Debt-service check, not balance-sheet financing mix |
| Asset turnover ratio | How efficiently does the company generate revenue from assets? | Efficiency check, not debt-versus-equity funding |
The strongest interpretation combines the ratio with cash-flow durability, interest cost, debt maturity, peer norms, and the quality of reported equity.
FAQ
What is the debt to equity ratio?
Debt to equity ratio compares liabilities or debt with shareholders’ equity. It is used to evaluate balance-sheet leverage and financing structure.
What is the debt to equity ratio formula?
The standard formula is total liabilities divided by shareholders’ equity. Some analysts use interest-bearing debt instead of total liabilities when they want a narrower debt-financing measure.
Is a high debt to equity ratio always bad?
No. A high ratio needs industry, business-model, maturity, interest-cost, and cash-flow context. Some capital-intensive companies can operate with higher leverage than asset-light companies.
What does a negative debt to equity ratio mean?
A negative ratio usually means shareholders’ equity is negative. That can happen when accumulated losses, write-downs, buybacks, or liabilities reduce equity below zero.