Net profit margin measures how much net income a company keeps from each dollar of revenue. It is a final income statement ratio calculated after operating costs, interest, taxes, and other below-operating items, so it reflects final accounting profitability rather than only product-level or operating profitability.
Definition: Net profit margin is net income divided by revenue, usually expressed as a percentage. A 12% net profit margin means the company kept 12 cents of net income for every dollar of revenue during the period measured.
In company analysis, net profit margin is a diagnostic ratio. It can help compare profitability across peers, track whether a company is becoming more or less profitable over time, and identify when reported revenue growth is not converting into final earnings. It does not prove business quality, valuation attractiveness, or future return potential by itself.
Key Points
- Net profit margin equals net income divided by revenue.
- The ratio includes the effect of operating costs, interest, taxes, and other below-operating items.
- Peer group, industry structure, and the company’s own margin trend matter more than a universal threshold.
- Net profit margin is useful only when checked against earnings quality, cash flow, one-time items, and business model context.
What Net Profit Margin Measures
Net profit margin measures the final share of revenue that remains after all expenses included in net income. The ratio sits near the bottom of the income statement because it reflects more than production cost or operating efficiency alone.
A higher net profit margin can reflect efficient conversion of revenue into final earnings, but the source of the improvement matters. Pricing power, cost discipline, asset-light economics, lower interest expense, tax effects, and one-time gains can all lift the ratio for different reasons.
A lower net profit margin can reflect weak profitability, heavy cost pressure, high interest expense, tax drag, restructuring costs, cyclicality, or temporary investment spending. The same percentage can mean different things for a software company, a retailer, a bank, and a commodity producer.
Net Profit Margin Formula
The net profit margin formula is:
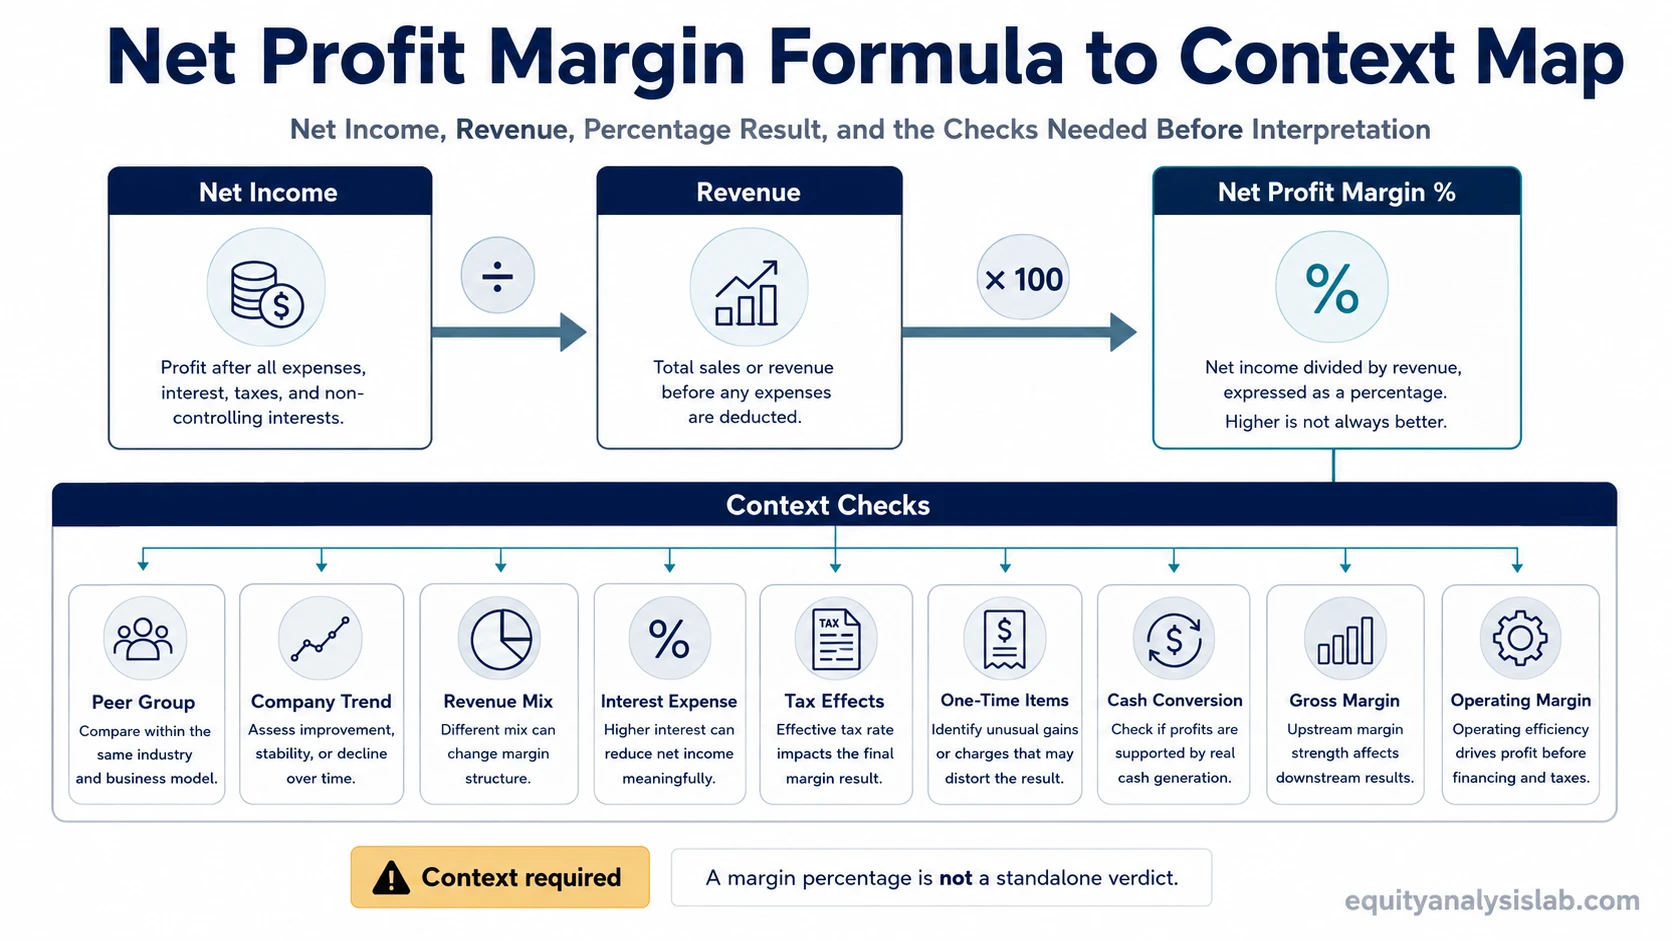
Net Profit Margin = Net Income ÷ Revenue × 100
Net income is the numerator. Revenue, also called sales in many financial statements, is the denominator. Multiplying by 100 converts the result into a percentage.
| Formula input | Where it usually comes from | Interpretation risk |
|---|---|---|
| Net income | Net income line near the bottom of the income statement | Can include one-time gains, one-time losses, tax effects, interest expense, and accounting items that may not repeat. |
| Revenue | Top line of the income statement | Can grow while profitability weakens if costs, financing expenses, or other deductions rise faster than sales. |
| Percentage result | Net income divided by revenue, multiplied by 100 | Needs comparison against peers, company history, business model, and accounting quality before interpretation. |
The same net profit margin can mean different things depending on peer group, revenue mix, interest expense, tax rate, recurring items, and cash conversion.
How to Calculate Net Profit Margin
For a simple calculation, consider a company with $500 million of revenue and $60 million of net income during the same period.
Example calculation: $60 million ÷ $500 million = 0.12. After multiplying by 100, the company’s net profit margin is 12%.
The ratio means the company kept 12% of revenue as net income after the costs and deductions included in the income statement. The calculation is simple; the interpretation depends on whether the margin is normal for the industry, stable across time, and supported by recurring earnings rather than temporary items.
How to Interpret Net Profit Margin
Net profit margin works best with two comparisons: similar companies and the same company’s own history. Peer comparison helps separate business-model differences from company-specific strength or weakness. Trend comparison shows whether the company is keeping more or less of each revenue dollar over time.
Industry structure shapes the baseline. Some businesses operate with high margins and low asset intensity, while others use lower margins and higher volume. A thin-margin retailer and a high-margin software company can both be healthy or unhealthy depending on turnover, reinvestment needs, competitive pressure, and balance-sheet structure.
Net margin also needs an efficiency check. Asset turnover ratio helps separate final profitability from revenue efficiency by showing how much revenue a company generates from its asset base.
| Interpretation check | What to compare | Why it matters |
|---|---|---|
| Peer group | Companies with similar business models, accounting bases, and industry exposure | A margin that looks high in one industry can be ordinary in another. |
| Company trend | Several periods of the same company’s net margin | A single strong period may reflect temporary items rather than durable profitability. |
| Revenue mix | Product, service, geography, and customer mix changes | A mix shift can lift or reduce margin without a simple change in operating quality. |
| Financing and tax effects | Interest expense, tax rate, and below-operating items | Net income includes effects that operating profit does not isolate. |
| Cash conversion | Net income versus operating cash flow and free cash flow | Accounting profit is more useful when it is supported by cash generation. |
What Is a Good Net Profit Margin?
A good net profit margin depends on the company’s industry, business model, maturity, capital needs, and accounting profile. There is no universal percentage that makes a net margin good across all companies.
The stronger question is whether the company’s margin is durable, explainable, and comparable. A high margin supported by recurring revenue, disciplined costs, and cash conversion has a different meaning than a high margin created by a one-time gain or unusually low tax expense.
A low margin is not automatically negative. Some businesses operate with low margins but high turnover, strong scale, or resilient cash generation. Others show low margins because competition, leverage, cost inflation, or weak pricing power is pressuring the business.
Why Net Profit Margin Can Mislead
Net profit margin can mislead when it is treated as a clean verdict on business quality. Because the ratio uses net income, it can move for reasons that are not fully tied to core operating performance.
Key limitation: Net profit margin is affected by taxes, interest expense, one-time items, accounting choices, cost structure, and business mix. The ratio needs cash flow, share count, recurring cost, and peer-context checks before it can support a broader profitability interpretation.
A company can report higher revenue while net profit margin falls if input costs, labor expense, marketing spend, interest expense, taxes, or one-time charges rise faster than sales. Headline revenue growth does not settle margin quality.
| What changes the reading | How it can affect net profit margin | What to check next |
|---|---|---|
| One-time gains or losses | Can temporarily inflate or depress net income | Look for recurring versus non-recurring items in the income statement notes. |
| Interest expense | Can reduce net margin even when operations are stable | Check leverage, debt cost, and interest coverage. |
| Tax rate changes | Can move net income without a matching change in operating performance | Compare effective tax rates across periods. |
| Cost inflation | Can compress margin even while revenue grows | Compare revenue growth with gross profit, operating income, and net income growth. |
| Accounting comparability | Can make two companies appear more similar or different than they really are | Check accounting policies, segment mix, and unusual items before comparing peers. |
Net Profit Margin vs Gross Margin and Operating Margin
Net profit margin belongs to the margin family, but it answers a different question than gross margin or operating margin. The distinction matters because each ratio stops at a different level of the income statement.
| Margin ratio | Calculation focus | Best use |
|---|---|---|
| Gross margin | Revenue after direct costs or cost of goods sold | Understanding product-level or service-level profitability before operating expenses. |
| Operating profitability before interest and taxes | Operating income relative to revenue | Evaluating core business profitability before interest and tax effects. |
| Net profit margin | Net income relative to revenue | Evaluating final accounting profitability after operating, financing, tax, and other items. |
Gross margin can look strong while net profit margin remains weak if operating costs, financing costs, taxes, or one-time charges absorb the profit created at the gross-profit level. Operating margin narrows the focus to core operations, while net margin shows the final income-statement result after operating, financing, tax, and other items.
Related Metrics to Check With Net Profit Margin
Net profit margin becomes more useful when it is paired with metrics that answer different questions. Profitability, efficiency, liquidity, leverage, and cash conversion can point in different directions, so a single margin ratio should not carry the full analysis.
| Analytical question | Metric relationship | Why it helps |
|---|---|---|
| Is revenue converting into final profit? | Net profit margin | Shows final accounting profitability after all income statement deductions. |
| Is the company using assets efficiently? | Asset turnover ratio | Shows whether revenue generation is strong or weak relative to the asset base. |
| Is reported profit supported by cash? | Operating cash flow and free cash flow | Helps test whether net income is translating into cash generation. |
| Is profitability diluted at the per-share level? | Share count and diluted EPS | Checks whether net income growth is offset by dilution. |
The strongest interpretation usually comes from a combined view: margin trend, peer comparison, cash conversion, balance-sheet pressure, and share-count movement. Net margin starts the profitability question; it does not finish the company-analysis process.
FAQ
What is net profit margin?
Net profit margin is net income divided by revenue, expressed as a percentage. It shows how much final accounting profit a company keeps from each dollar of revenue.
How do you calculate net profit margin?
Divide net income by revenue, then multiply the result by 100. For example, $60 million of net income on $500 million of revenue equals a 12% net profit margin.
Is a higher net profit margin always better?
No. A higher net profit margin can be useful, but it must be checked against peer group, company trend, one-time items, tax effects, interest expense, and cash-flow support.
Why can net profit margin differ from operating margin?
Operating margin focuses on operating income before interest and taxes. Net profit margin uses net income, so it includes financing costs, tax effects, one-time items, and other below-operating items.