Asset turnover ratio compares a company’s revenue or net sales with its average total assets to show how much sales volume the asset base produces. It is a diagnostic efficiency ratio, not a standalone measure of business quality, valuation, or investment attractiveness.
Definition: Asset turnover ratio measures revenue generated for each dollar of average total assets during a reporting period.
The ratio connects the income statement with the balance sheet. Revenue or net sales comes from activity during the period, while total assets are usually averaged between the start and end of that period. That timing match matters because a single ending asset balance can distort the reading when a company has bought assets, sold assets, written assets down, or changed working-capital intensity during the period.
Key Points
- Asset turnover ratio compares revenue or net sales with average total assets.
- The formula is revenue or net sales divided by average total assets.
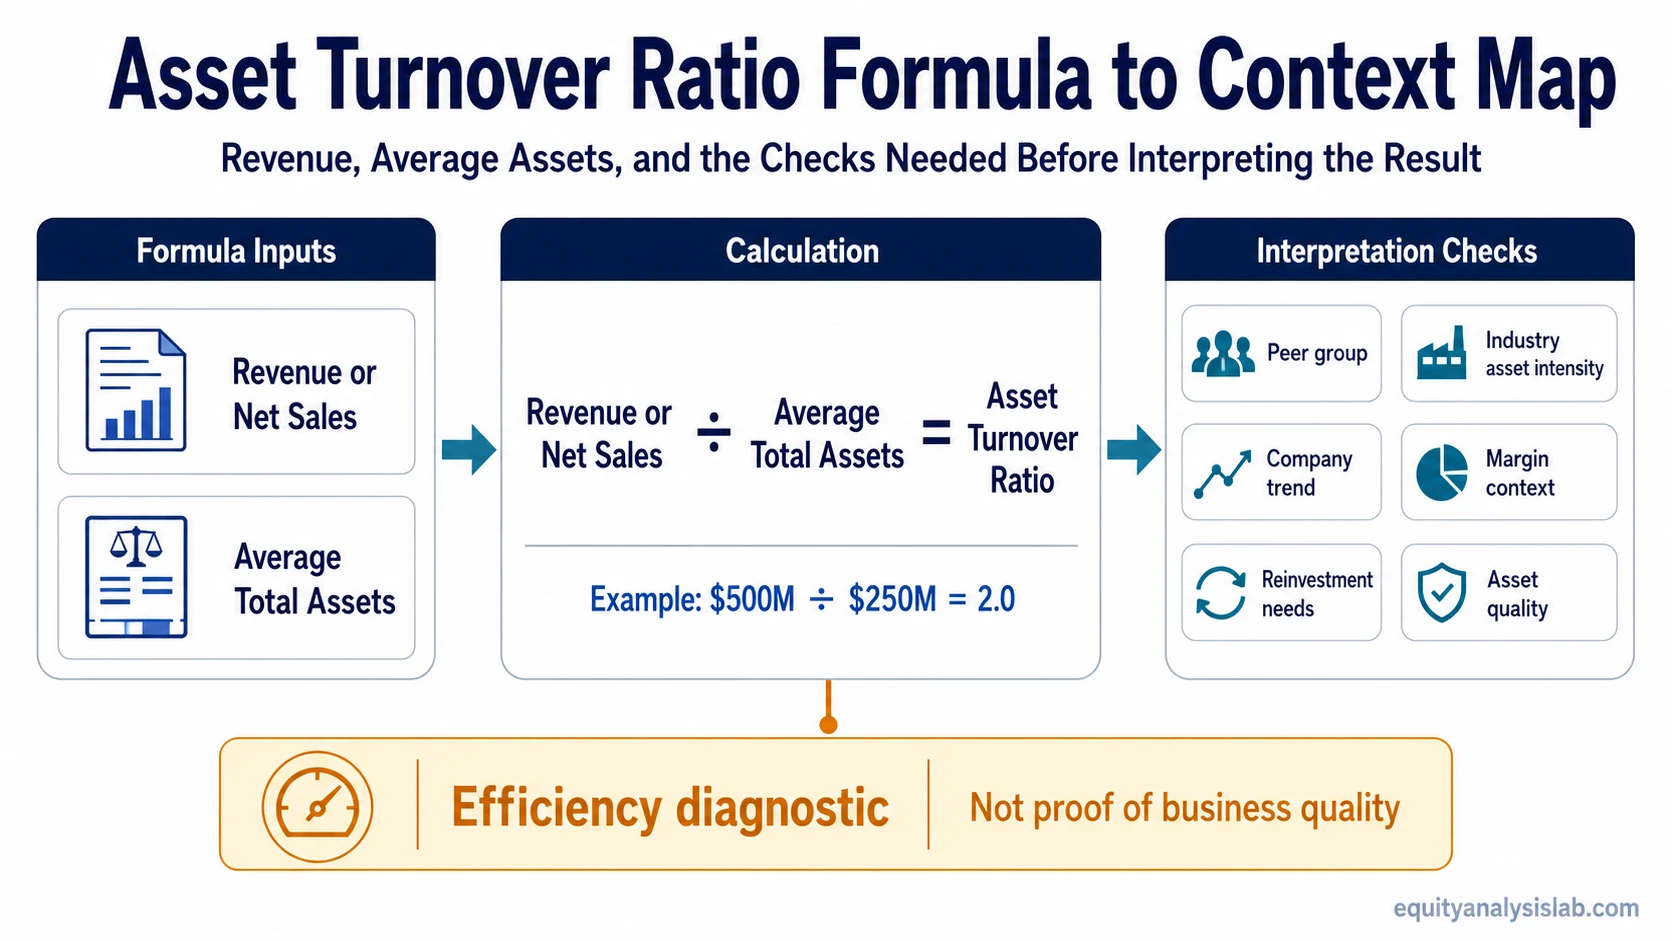
- The ratio is most useful when compared with peers, industry norms, and the company’s own trend.
- A higher ratio is not automatically better if margins, reinvestment, or asset quality are weak.
What Is the Asset Turnover Ratio?
The asset turnover ratio is a company-analysis metric used to evaluate how efficiently a business turns its asset base into sales. A ratio of 2.0 means the company generated $2.00 of revenue for each $1.00 of average total assets during the period.
The ratio should not be read as “high equals good” or “low equals bad.” Its value depends on whether the sales produced by the asset base make sense for the company’s business model, industry, asset intensity, margin structure, and history.
| What the ratio shows | What it does not show |
|---|---|
| How much revenue the company generates from its average asset base. | Whether the company is profitable, undervalued, or attractive as an investment. |
| Whether asset use appears more or less productive over time. | Whether margins, cash flow, debt, or competitive position are strong. |
| How a company’s sales productivity compares with similar businesses. | Whether companies in different industries can be compared directly. |
Asset Turnover Ratio Formula
The standard formula is:
Asset Turnover Ratio = Net Sales or Revenue / Average Total Assets
Net sales is often preferred when available because it removes sales returns, allowances, and discounts. If net sales is not separately available, revenue is commonly used. The denominator is average total assets, not just ending total assets, because the ratio compares a period-based sales figure with the asset base used across that period.
| Formula input | Where it usually comes from | Why it matters |
|---|---|---|
| Revenue or net sales | Income statement | Shows the sales volume produced during the reporting period. |
| Beginning total assets | Balance sheet at the start of the period | Captures the asset base before the period’s activity. |
| Ending total assets | Balance sheet at the end of the period | Captures the asset base after the period’s activity. |
| Average total assets | Beginning assets plus ending assets, divided by two | Creates a more balanced denominator than using only the ending asset figure. |
How to Calculate Asset Turnover Ratio
To calculate asset turnover ratio, first calculate average total assets. Add beginning total assets and ending total assets, then divide by two. Then divide revenue or net sales by average total assets.
Example: A company has $500 million in revenue, $240 million in beginning total assets, and $260 million in ending total assets. Average total assets are $250 million, calculated as $240 million plus $260 million, divided by two. The asset turnover ratio is 2.0, calculated as $500 million divided by $250 million.
That result means the company generated $2.00 of revenue for each $1.00 of average assets during the period. The number becomes more useful when compared with similar companies and with the same company’s prior periods.
| Step | Calculation | Result |
|---|---|---|
| Beginning total assets | Given | $240 million |
| Ending total assets | Given | $260 million |
| Average total assets | ($240 million + $260 million) / 2 | $250 million |
| Asset turnover ratio | $500 million / $250 million | 2.0 |
How to Interpret Asset Turnover Ratio
Asset turnover ratio is best interpreted as sales productivity from assets. A higher ratio can suggest that a company generates more revenue from each dollar of assets, but the quality of that reading depends on margins, reinvestment needs, asset age, working-capital structure, and business model.
A lower ratio can suggest that a company needs a larger asset base to generate revenue, but that is not automatically negative. Asset-heavy businesses often require factories, stores, infrastructure, equipment, inventory, or regulated assets. Those companies may naturally show lower asset turnover than asset-light software, service, or platform businesses.
| Reading | Possible interpretation | Context needed |
|---|---|---|
| Higher asset turnover | The company produces more revenue per dollar of assets. | Check whether margins, reinvestment, and asset quality support the reading. |
| Lower asset turnover | The company produces less revenue per dollar of assets. | Check whether the business is naturally asset-heavy or in an investment phase. |
| Improving trend | Sales productivity may be improving relative to the asset base. | Check whether the change came from stronger revenue, asset sales, or write-downs. |
| Declining trend | The asset base may be growing faster than revenue. | Check whether recent investment has not yet produced sales, or whether demand is weakening. |
Why Industry Context Changes the Reading
There is no universal asset turnover ratio that is good for every company. The ratio is much more useful inside a comparable group of businesses than across unrelated sectors.
A retailer, manufacturer, utility, bank, software company, and consulting firm can all have very different asset structures. The same ratio value may be strong in one industry and ordinary or weak in another. Even within the same sector, business models can differ if one company owns assets directly while another leases, outsources, or operates with a lighter balance sheet.
Interpretation rule: Compare asset turnover against similar companies, similar accounting periods, and the company’s own history. Cross-industry comparisons can create false confidence because asset intensity varies widely by business model.
When Asset Turnover Ratio Can Mislead
Asset turnover can look clean while the underlying interpretation is incomplete. A company may show a stronger ratio because assets were sold, written down, depreciated heavily, or kept artificially low through underinvestment. The ratio can also look strong in a low-margin business where high sales volume does not translate into strong profit or cash flow.
A rising ratio should be separated into genuine revenue improvement versus mechanical denominator shrinkage from asset sales, write-downs, or underinvestment.
Common mistake: Treating a high asset turnover ratio as proof of business quality. The ratio only shows revenue generated relative to assets. It does not confirm margin strength, cash generation, balance-sheet resilience, or valuation support.
| Distortion | Why it matters |
|---|---|
| Asset sales | The denominator may shrink, making turnover look better even if revenue quality has not improved. |
| Asset write-downs | A lower asset base can mechanically lift the ratio after past asset values were reduced. |
| Underinvestment | A lean asset base may raise turnover temporarily while weakening future capacity or competitiveness. |
| Low-margin sales | High turnover may not help much if each dollar of revenue produces little profit or cash flow. |
| Business-model mismatch | Asset-light and asset-heavy companies can produce very different turnover ratios for structural reasons. |
Related Ratios That Add Context
Asset turnover ratio answers an efficiency question, but it does not answer liquidity, leverage, or interest-burden questions. Those separate checks help prevent a single ratio from carrying too much interpretation weight.
The current ratio helps evaluate short-term liquidity by comparing current assets with current liabilities.
A company’s debt-to-equity ratio adds leverage context by comparing debt with shareholders’ equity.
Interest burden can be checked with an interest coverage measure, which compares operating earnings with interest expense.
Fixed asset turnover and operating asset turnover are related variants. They narrow the asset base to more specific operating or fixed-asset categories, but they should be used only when that narrower denominator matches the analysis question.
Asset Turnover Ratio FAQ
What is the asset turnover ratio?
Asset turnover ratio measures how much revenue or net sales a company generates for each dollar of average total assets during a reporting period.
How do you calculate asset turnover ratio?
Calculate average total assets by adding beginning total assets and ending total assets, then dividing by two. Then divide revenue or net sales by average total assets.
What is a good asset turnover ratio?
There is no universal good asset turnover ratio. A useful comparison depends on the company’s industry, asset intensity, business model, reporting period, and historical trend.
What does a high asset turnover ratio mean?
A high asset turnover ratio can mean the company generates more revenue from each dollar of assets, but it is not automatically positive unless margins, reinvestment, asset quality, and peer context also support the reading.
What does a low asset turnover ratio mean?
A low asset turnover ratio can mean the company produces less revenue from its asset base, but it may be normal for asset-heavy businesses or companies investing ahead of future revenue.