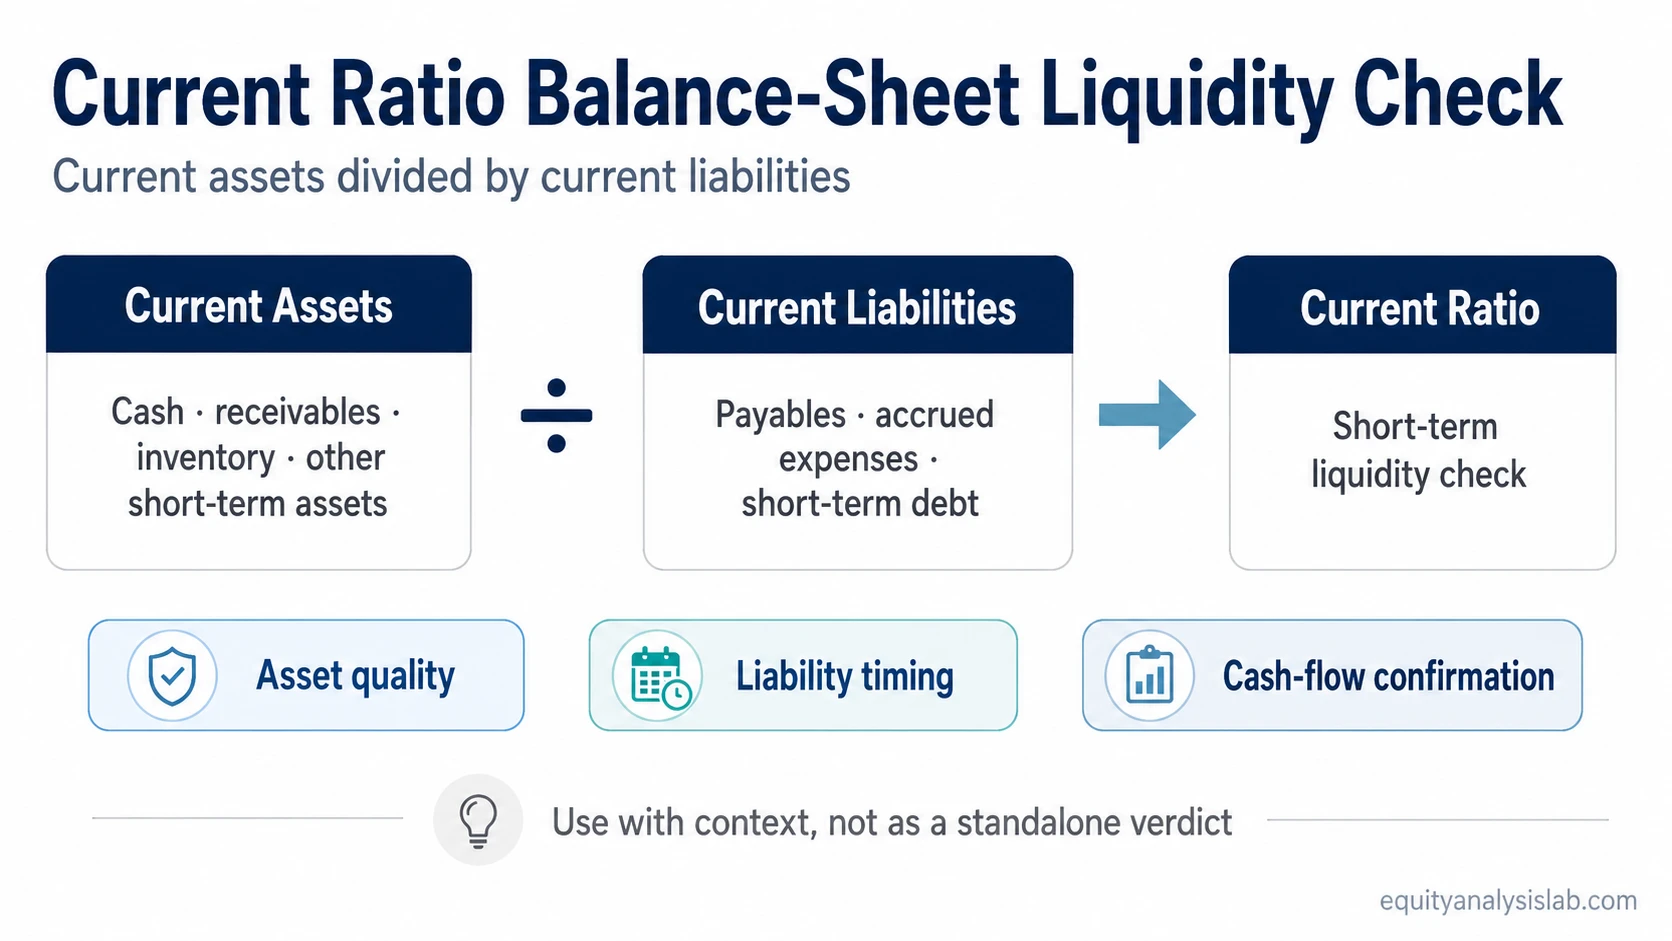
Current ratio is a liquidity ratio that compares a company’s current assets with its current liabilities. It is calculated as current assets divided by current liabilities and helps investors judge whether short-term resources appear sufficient against short-term obligations.
For company analysis, the current ratio is a balance-sheet check, not a standalone verdict on business quality, valuation attractiveness, or future stock returns.
Key Points
- Current ratio equals current assets divided by current liabilities.
- It measures short-term balance-sheet liquidity.
- A ratio above 1 does not automatically mean a company is financially strong.
- Industry norms, asset quality, seasonality, liability timing, and cash-flow confirmation can change the interpretation.
What Is the Current Ratio?
Current ratio measures whether a company has enough current assets to cover current liabilities due within one year or the normal operating cycle.
The ratio uses balance-sheet items. Current assets are resources expected to be converted into cash, sold, or used within the operating cycle. Current liabilities are obligations expected to be settled within the short term.
Investors use the current ratio to check liquidity pressure before moving into broader analysis of profitability, leverage, cash flow, and valuation. A weak current ratio can point to short-term funding pressure, while a very high ratio may sometimes suggest excess idle assets or inefficient working-capital use.
Current Ratio Formula
Current ratio = Current assets / Current liabilities
The calculation divides short-term resources by short-term obligations. A current ratio of 1.5 means the company reports $1.50 of current assets for every $1.00 of current liabilities.
What Counts as Current Assets and Current Liabilities?
The current ratio depends on what is included in each side of the balance sheet. The headline number can change meaning depending on the quality and timing of those inputs.
| Input | Common examples | Investor interpretation issue |
|---|---|---|
| Current assets | Cash, short-term investments, accounts receivable, inventory, prepaid expenses, and other short-term assets | Not every current asset converts into cash with the same speed or certainty. |
| Current liabilities | Accounts payable, accrued expenses, taxes payable, short-term debt, and the current portion of long-term debt | Debt maturity and payment timing can make the ratio more important than the headline number suggests. |
Current Ratio Example
Suppose a company reports $300 million of current assets and $200 million of current liabilities.
Current ratio = $300 million / $200 million = 1.5
This means the company has $1.50 of current assets for every $1.00 of current liabilities.
The result is only a starting point. Investors still need to check whether the assets are collectible or liquid, whether liabilities are coming due soon, and whether operating cash flow supports the balance-sheet picture.
How Investors Interpret the Current Ratio
There is no universal “good” current ratio. The right interpretation depends on the company’s industry, business model, working-capital cycle, and historical trend.
| Current ratio range | What it can suggest | Why context matters |
|---|---|---|
| Below 1.0 | Current liabilities exceed current assets. | This may signal liquidity pressure, but some companies operate with negative working capital because customers pay before suppliers are paid. |
| Around 1.0 | Current assets roughly match current liabilities. | The company may be tightly balanced, so asset quality and near-term cash generation become important. |
| Above 1.0 | Current assets exceed current liabilities. | This can indicate a liquidity cushion, but the cushion is weaker if assets are tied up in slow inventory or difficult receivables. |
| Very high | The company has a large current-asset base relative to short-term obligations. | This may be conservative liquidity management, seasonal buildup, or inefficient use of assets depending on the business. |
The most useful comparison is usually against similar companies and against the company’s own history. A stable current ratio may mean something different from a sudden decline, even if both numbers remain above 1.
Why a High or Low Current Ratio Can Mislead
The current ratio is a snapshot. It does not show the exact timing of cash collections, inventory sales, debt payments, or supplier obligations.
- Inventory quality: Inventory may be counted as a current asset even when it is slow-moving, obsolete, or difficult to sell without discounting.
- Receivables timing: Accounts receivable may look strong on the balance sheet, but delayed collections can weaken real liquidity.
- Liability timing: A company with near-term debt maturities may face more pressure than the headline ratio suggests.
- Seasonality: Retailers, manufacturers, and cyclical businesses can show temporary changes around inventory build, sales periods, or payment cycles.
- Operating cash flow: A company can report a reasonable current ratio while still struggling to generate cash from operations.
What Changes the Interpretation?
A stronger current-ratio analysis looks beyond the single number and asks what is driving it.
| Question | Why it matters |
|---|---|
| Is the ratio high because of cash or because of inventory? | Cash is usually more liquid than inventory, so the same ratio can carry different liquidity quality. |
| Are receivables growing faster than revenue? | This can raise the ratio while also hinting at collection risk or weaker cash conversion. |
| Are current liabilities rising because short-term debt is increasing? | Debt maturity pressure can make the ratio more important for solvency analysis. |
| Is the change seasonal or structural? | A temporary inventory build may not mean the same thing as a persistent deterioration in liquidity. |
| Does operating cash flow confirm the balance-sheet signal? | Liquidity is more reliable when the company also generates cash from core operations. |
Current Ratio vs Related Metrics
The current ratio answers one question: whether current assets appear sufficient relative to current liabilities. Other metrics answer different company-analysis questions.
- Quick ratio: A stricter liquidity ratio that removes inventory from current assets.
- Cash ratio: A narrower liquidity check focused on cash and cash equivalents.
- Operating cash flow ratio: A cash-flow-based liquidity check that compares operating cash flow with current liabilities.
- Debt-to-equity ratio: A leverage metric that compares debt financing with shareholder equity.
- Interest coverage: A debt-service metric that checks whether earnings can cover interest expense.
- Asset turnover ratio: An efficiency metric that shows how much revenue a company generates from its assets.
A full comparison between current ratio and quick ratio belongs in a dedicated comparison because the key issue is not just the formula, but how inventory changes the liquidity signal.
When the Current Ratio Is Most Useful
The current ratio is most useful when it is used as one part of balance-sheet analysis. It can help investors notice short-term liquidity risk, compare companies in the same industry, and check whether working-capital changes are improving or deteriorating over time.
It is less useful as a standalone screen. A company can have a comfortable current ratio and still face weak margins, poor cash conversion, heavy leverage, dilution, or valuation risk. The ratio should support investor judgment, not replace it.
FAQ
What is the current ratio?
The current ratio is a liquidity ratio calculated as current assets divided by current liabilities. It shows how much short-term asset coverage a company reports relative to short-term obligations.
What is a good current ratio?
There is no universal good current ratio. A useful interpretation depends on the company’s industry, business model, asset quality, liability timing, cash-flow profile, and historical trend.
Is a higher current ratio always better?
No. A higher current ratio can indicate more liquidity, but it can also reflect idle cash, slow inventory, delayed receivable collection, or inefficient asset use.
Where do the current ratio inputs come from?
The inputs come from the balance sheet. Current assets are divided by current liabilities to calculate the ratio.