Interest coverage ratio measures how much operating profit is available to cover a company’s interest expense. The core formula is EBIT or operating income divided by interest expense, which makes the ratio a debt-service check rather than a complete verdict on business quality, valuation, or future stock returns.
Definition: Interest coverage ratio is a company-analysis metric that compares earnings before interest and taxes, or operating income, with the interest expense due over the same period.
A higher ratio usually means the company has more operating profit available before interest becomes restrictive. A lower ratio usually means interest expense absorbs a larger share of operating profit. The reading becomes more useful when the earnings base, debt structure, cash conversion, and industry profile are checked together.
Key Points
- Interest coverage ratio measures operating profit relative to interest expense.
- The standard formula is EBIT or operating income divided by interest expense.
- Interpretation depends on peer group, trend, industry, accounting base, and cash-flow conversion.
- High coverage does not remove refinancing, cyclicality, principal repayment, or cash-flow risk.
Interest Coverage Ratio Formula
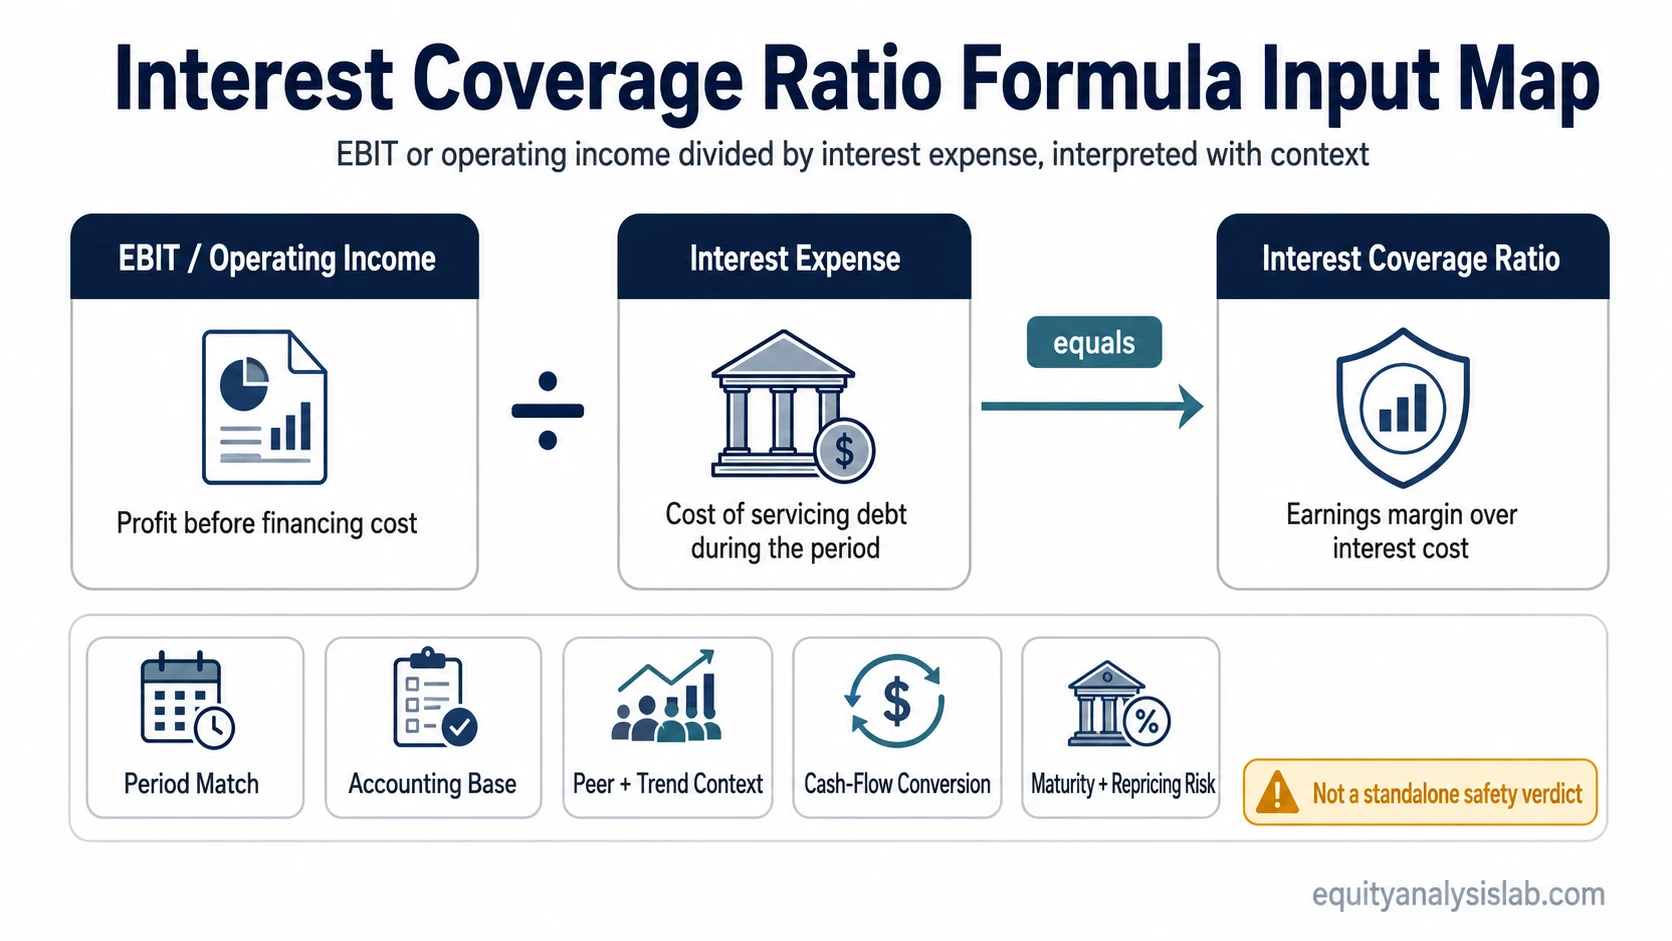
Formula: Interest coverage ratio = EBIT or operating income ÷ interest expense.
EBIT and operating income are often used as the numerator because they measure profit before financing cost. The denominator is interest expense, not total debt and not principal repayment. The period should match: annual EBIT should be compared with annual interest expense, while quarterly operating income should be compared with quarterly interest expense.
Different sources may use EBIT, operating income, or adjusted operating profit. That choice can change the result, so consistency matters when comparing companies or reviewing a trend through time.
What the Formula Inputs Mean
The ratio is only as useful as the inputs behind it. A clean formula can still create a misleading reading when earnings quality, accounting adjustments, or cash conversion are weak.
| Formula input | Where it usually comes from | What it tells you | Main interpretation risk |
|---|---|---|---|
| EBIT or operating income | Income statement | Profit available before financing cost | Positive accounting earnings may not convert into cash |
| Interest expense | Income statement or notes | Cost of servicing debt during the period | Current interest expense may not reflect future refinancing or repricing |
| Period | Quarterly, trailing twelve-month, or annual figures | Timeframe used for the coverage calculation | Mismatched periods can inflate or understate coverage |
| Accounting base | Reported or adjusted figures | Whether the calculation uses standard or adjusted earnings | Adjustments can make coverage look smoother than the underlying business |
How To Interpret Interest Coverage Ratio
Interest coverage ratio is strongest as a comparison tool. A single number needs peer, trend, and industry context because companies differ in capital intensity, earnings stability, debt structure, and access to financing.
A good interest coverage ratio is not a universal number. The same ratio can mean different things depending on the peer group, industry capital intensity, earnings stability, cash conversion, debt maturity schedule, and interest-rate exposure.
| Reading angle | What to compare | Why it matters |
|---|---|---|
| Peer comparison | Companies in the same industry or business model group | A normal coverage level for one sector may be weak or unusually strong in another |
| Trend comparison | The company’s ratio across several periods | Falling coverage can reveal pressure even before the absolute number looks alarming |
| Earnings quality | Recurring operating income versus one-time gains or adjusted profit | Temporary earnings support can make interest coverage look more durable than it is |
| Cash-flow support | Operating cash flow, free cash flow, working capital, and capital spending needs | Earnings coverage is not the same as cash resilience |
A high ratio can indicate breathing room, but it is not proof that debt risk is low. A low ratio can flag pressure, but the severity depends on earnings durability, maturity structure, floating-rate exposure, and liquidity.
Example Interest Coverage Ratio Calculation
A calculation illustration: a company reports $120 million of EBIT and $30 million of interest expense for the year. Its interest coverage ratio is 4.0x because $120 million divided by $30 million equals 4.0.
If EBIT falls to $60 million while interest expense stays at $30 million, the ratio falls to 2.0x. The debt balance may not have changed, but the operating-profit margin over interest expense has become thinner.
The example highlights the main sensitivity in the ratio: interest coverage can deteriorate because debt costs rise, because operating profit falls, or because both happen together. Trend analysis usually matters more than treating one period as a final answer.
Common Misunderstanding: Coverage Is Not the Same as Safety
Common mistake: A strong interest coverage ratio is often read as proof that debt is safe. The ratio only shows the relationship between earnings and interest expense for the measured period.
Several conditions can weaken a comfortable-looking ratio. EBIT is not cash flow. Working capital needs, capital expenditure, restructuring costs, or delayed customer collections can reduce the cash available to service debt. Interest expense can also reprice when floating-rate debt resets or when maturing debt is refinanced at a higher cost.
Principal repayment is another boundary. Interest coverage compares earnings with interest expense, but it does not show whether the company can repay or refinance the debt balance itself. A company can cover interest and still face pressure if maturities are near, cash generation is weak, or earnings are highly cyclical.
Limitation: Interest coverage is best treated as one debt-service check. It should be read alongside leverage, liquidity, cash flow, maturity structure, and earnings durability.
Interest Coverage Ratio vs Related Metrics
Interest coverage ratio focuses on whether operating profit covers interest expense. Related metrics answer different company-analysis questions, so they should not be used interchangeably.
| Metric | Main question | How it differs from interest coverage ratio |
|---|---|---|
| Debt-to-equity ratio | How large is the debt burden relative to shareholders’ equity? | It measures balance-sheet leverage, while interest coverage measures operating profit relative to interest expense. |
| Current ratio | Can current assets cover current liabilities? | It measures short-term liquidity, while interest coverage focuses on financing cost relative to operating profit. |
| Asset turnover ratio | How efficiently does the company generate sales from assets? | It measures operating efficiency, while interest coverage measures debt-service capacity from earnings. |
Together, these metrics separate three different questions: how much debt sits on the balance sheet, whether near-term obligations can be met, and whether operating profit can absorb interest cost.
FAQ
What is the formula for interest coverage ratio?
The standard formula is EBIT or operating income divided by interest expense. The numerator and denominator should cover the same reporting period.
Is a higher interest coverage ratio always better?
A higher ratio usually indicates more earnings cushion, but it is not always better by itself. Peer group, trend, earnings quality, cash flow, debt maturity, and interest-rate exposure can change the interpretation.
Does interest coverage ratio include principal repayment?
No. Interest coverage ratio compares earnings with interest expense. It does not directly measure principal repayment, refinancing risk, or total debt maturity pressure.