Return on assets is a profitability and asset-efficiency ratio that compares net income with average total assets. It shows how much profit a company produces from the assets used in the business.
ROA is a diagnostic measure, not a complete verdict on business quality, valuation, cash conversion, balance-sheet safety, or investment attractiveness. A high result can reflect strong profit generation, an asset-light model, older depreciated assets, a temporarily low asset base, or non-recurring accounting effects, so the ratio needs peer group, trend, and accounting context before interpretation.
The denominator matters as much as the profit figure. Two companies can report the same net income, but the one using fewer assets will show a higher ROA, while the one carrying more factories, inventory, acquired assets, or capitalized costs may show a lower result even when the business is operating normally for its industry.
Key Points
- Return on assets compares net income with average total assets.
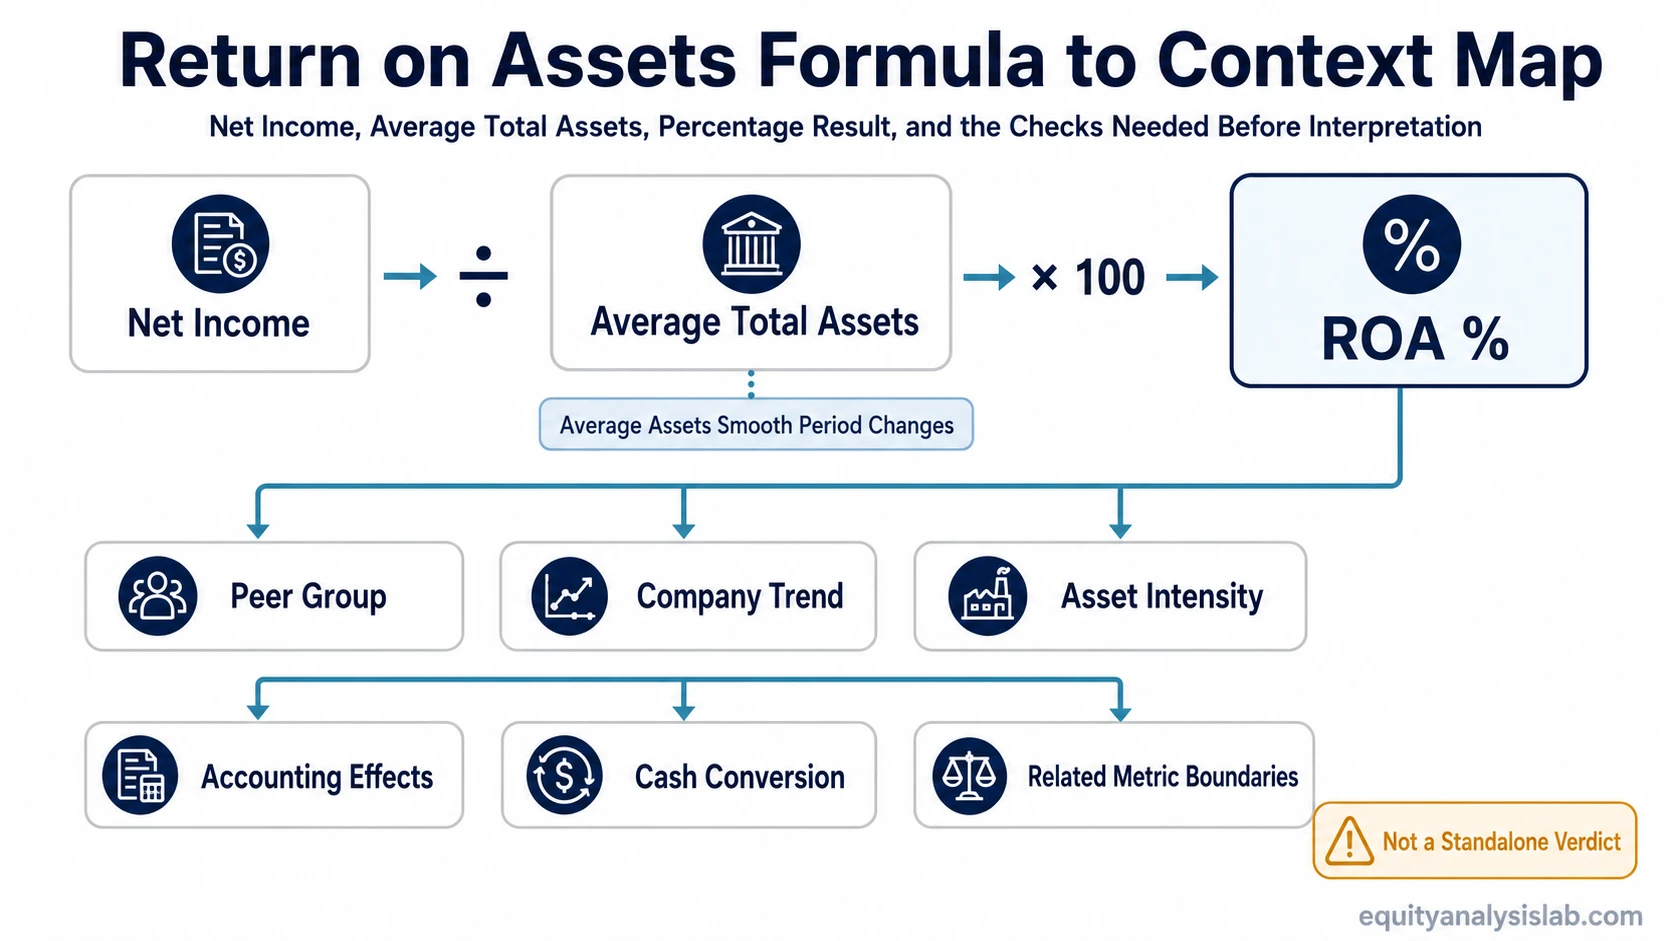
- The standard formula is net income divided by average total assets, multiplied by 100.
- Average total assets usually give a cleaner denominator than ending total assets when the asset base changes during the period.
- ROA is most useful when compared with similar companies and the same company’s own trend.
- A high ROA does not automatically prove cash conversion, business durability, valuation appeal, or investment quality.
What Return on Assets Measures
Definition: Return on assets measures the relationship between the profit a company keeps after expenses and the total asset base used to produce that profit.
The numerator is net income. The denominator is usually average total assets, which smooths the asset base across the period instead of relying only on the balance sheet at one date.
The useful question is not simply whether the percentage is high or low. The better question is what produced the percentage: durable earnings, lower asset needs, asset age, accounting changes, acquisitions, write-downs, or a temporary profit effect.
Return on Assets Formula
The standard return on assets formula is:
Return on Assets = Net Income / Average Total Assets × 100
| Formula part | Meaning | Why it matters |
|---|---|---|
| Net income | Profit after expenses, interest, taxes, and other items. | It shows the profit available after the full income statement has been processed. |
| Average total assets | Total assets at the beginning and end of the period, divided by two. | It reduces distortion when assets changed during the period. |
| Multiply by 100 | Converts the ratio into a percentage. | It makes the result easier to compare across periods and companies. |
Some analysts use ending total assets for a quick estimate, but average total assets are usually more useful when the company acquired assets, sold assets, recorded write-downs, or changed its balance sheet materially during the period.
How to Calculate Return on Assets
Return on assets can be calculated in four steps.
- Find net income on the income statement.
- Find beginning total assets and ending total assets on the balance sheet.
- Calculate average total assets by adding beginning assets and ending assets, then dividing by two.
- Divide net income by average total assets and multiply by 100.
The result estimates how much profit the company generated for each dollar of average assets during the period.
Return on Assets Example
A hypothetical company earns $12 million in net income and has $100 million in average total assets.
ROA = $12 million / $100 million × 100 = 12%
A 12% ROA means the company produced $0.12 of net income for each $1 of average assets. That result still needs context. It may be strong for one industry, ordinary for another, or temporarily inflated if the company benefited from a one-time gain or a reduced asset base.
How to Interpret Return on Assets
Return on assets is most useful when the comparison set is controlled. The ratio should usually be read against similar companies, the company’s own history, and the asset requirements of the business model.
| Context check | Question to ask | Why it changes interpretation |
|---|---|---|
| Peer group | Are the companies in the same industry or business model? | Asset-heavy and asset-light companies often have structurally different ROA levels. |
| Company trend | Is ROA improving, weakening, or unusually volatile over time? | A trend can reveal margin pressure, asset efficiency changes, or temporary profit effects. |
| Asset intensity | Does the business require factories, inventory, equipment, or large working capital? | More asset-intensive companies may naturally report lower ROA than software-like models. |
| Accounting context | Were there acquisitions, impairments, unusual gains, or write-downs? | Accounting changes can alter net income or total assets without showing a durable operating change. |
| Cash conversion | Does reported profit convert into operating cash flow or free cash flow? | ROA uses net income, so it does not by itself prove cash generation. |
Universal “good ROA” thresholds are risky because asset needs differ widely across industries. A capital-light business can show a high ROA with modest assets, while a regulated utility, manufacturer, bank, or retailer may need a much larger asset base to produce earnings.
Why the Asset Base Changes ROA
The denominator can change the ratio even when net income is stable. That makes the asset base a key part of ROA interpretation, not just a mechanical formula input.
| Asset-base issue | How it can affect ROA | Interpretation risk |
|---|---|---|
| Asset-light model | Fewer assets can produce a higher ROA. | The result may reflect business model structure rather than superior management. |
| Asset-heavy model | More assets can produce a lower ROA. | The ratio may look weak even when the company is normal for its industry. |
| Older depreciated assets | Book assets can fall over time through depreciation. | ROA can rise because the denominator shrank, not because operations improved. |
| Acquisitions | Acquired assets and goodwill can expand the balance sheet. | ROA can fall after a deal even before the economic value of the acquisition is clear. |
| Write-downs | Impairments can reduce the asset base. | Later ROA may appear better because the denominator has been reset lower. |
| Intangible assets | Some valuable assets may not be fully reflected on the balance sheet. | ROA comparisons can be distorted when one business relies more on internally developed intangible assets. |
Common Return on Assets Mistakes
Common mistake: Treating ROA as a simple quality label can hide the source of the result. The ratio is more useful when the numerator, denominator, and comparison set are checked separately.
| Mistake | Why it causes distortion | Cleaner approach |
|---|---|---|
| Using gross profit instead of net income | Gross profit excludes operating expenses, interest, taxes, and other items. | Use net income for the standard ROA formula. |
| Using ending assets without checking changes | Ending assets may not represent the asset base used during the full period. | Use average total assets when balance-sheet changes are meaningful. |
| Comparing unrelated industries | Different industries require different asset levels to operate. | Compare ROA within a relevant peer group. |
| Ignoring one-time gains or losses | Temporary items can raise or lower net income without reflecting recurring profitability. | Review the income statement and notes for unusual items. |
| Treating high ROA as investment proof | ROA does not by itself prove cash conversion, durability, balance-sheet safety, or valuation appeal. | Use ROA as one diagnostic input alongside other financial and valuation work. |
Return on Assets vs Related Metrics
Return on assets should be separated from nearby ratios because each one answers a different question.
| Metric | Main base | What it answers |
|---|---|---|
| Return on assets | Average total assets | How much net income the company produces per dollar of assets. |
| return on equity ratio | Shareholders’ equity | How much profit the company produces relative to the equity base, with greater sensitivity to leverage. |
| returns on invested capital | Invested capital | How profit compares with a narrower capital base used to fund operations. |
| asset turnover ratio | Total or average assets | How much revenue the company generates per dollar of assets, before profit margins are considered. |
This boundary matters because revenue efficiency, profit efficiency, equity returns, and invested-capital returns can move in different directions. A company can generate high revenue per asset but low profit per asset if margins are weak.
Limitations of Return on Assets
Limitation: Return on assets is useful, but it is not a complete measure of company quality. It can be affected by industry structure, asset age, accounting policy, depreciation, tax effects, interest expense, acquisitions, write-downs, and non-recurring profit or loss.
- Industry comparability is limited. Asset-light and asset-heavy companies can have structurally different ROA levels.
- Accounting can distort the denominator. Depreciation, impairments, and acquisition accounting can change total assets without showing an operating improvement.
- Leverage and tax effects can affect net income. ROA uses net income, so financing structure and tax items can influence the numerator.
- Cash conversion needs separate review. A company can report profit without converting that profit into strong cash flow.
- Business durability requires more evidence. A high ROA can be temporary if margins, demand, or asset levels change.
- Investment attractiveness requires separate analysis. Valuation, risk, growth durability, balance-sheet strength, and cash generation still matter.
A brief adjusted ROA or EBIT-based ROA can sometimes help isolate operating performance before financing effects, but that measure should be clearly labeled and kept separate from the standard net-income-based formula.
FAQ
What does return on assets measure?
Return on assets measures how much net income a company produces relative to its average total assets. It is a profitability and asset-efficiency ratio.
What is the return on assets formula?
The standard return on assets formula is net income divided by average total assets, multiplied by 100.
Is a higher return on assets always better?
No. A higher ROA can be positive, but it can also reflect an asset-light model, older depreciated assets, a temporarily low asset base, or non-recurring profit. Peer group and trend context matter.
Why use average total assets in ROA?
Average total assets reduce distortion when the asset base changes during the period. Ending assets alone may not represent the assets used across the full period.
What is the difference between ROA and ROE?
ROA compares net income with total assets. ROE compares net income with shareholders’ equity and is more sensitive to leverage.