Accounts payable turnover ratio measures how many times a company pays suppliers relative to its average accounts payable during a period. It is usually calculated as net credit purchases divided by average accounts payable.
For investors, the ratio is most useful as a working-capital diagnostic. It can show how quickly a company is paying suppliers, but it should not be treated as a standalone verdict on liquidity, supplier strength, business quality, valuation, or future stock returns.
What Is the Accounts Payable Turnover Ratio?
The accounts payable turnover ratio is an operating-efficiency ratio that compares a company’s supplier credit purchases with its average accounts payable balance. It focuses on the payment side of working capital: how often the company turns over what it owes to suppliers.
A higher or lower result does not carry the same meaning in every industry. The ratio becomes useful when it is compared with the same company’s history, similar peers, supplier terms, cash-flow quality, and other operating-efficiency metrics.
Key Points
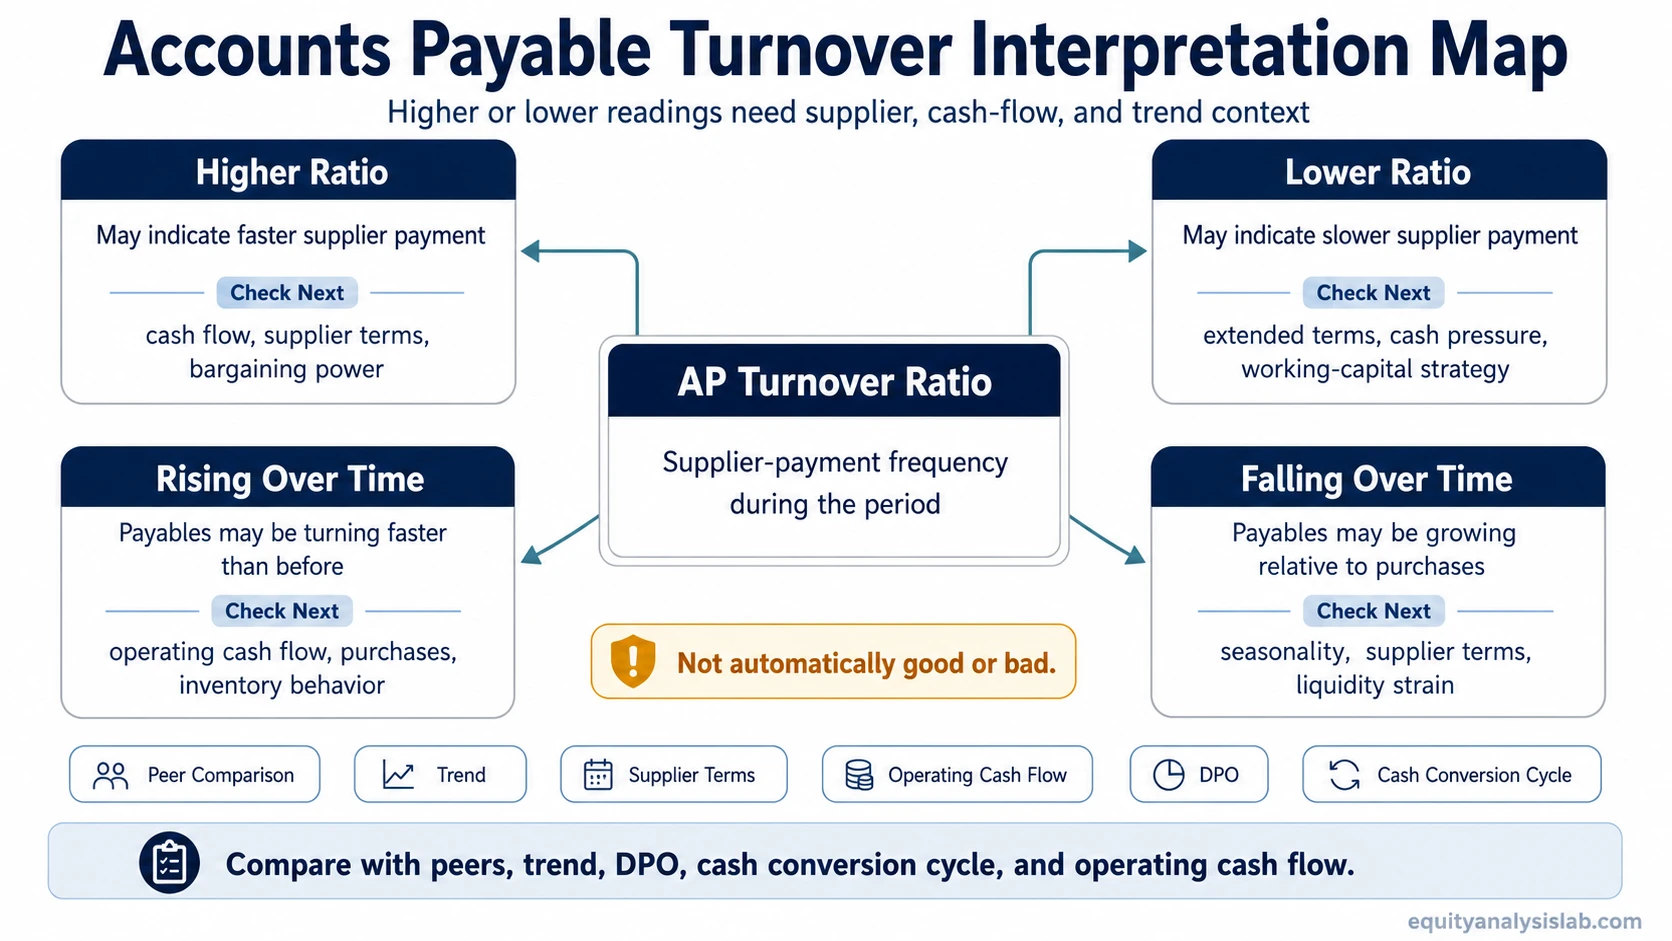
- Accounts payable turnover ratio measures supplier-payment frequency during a period.
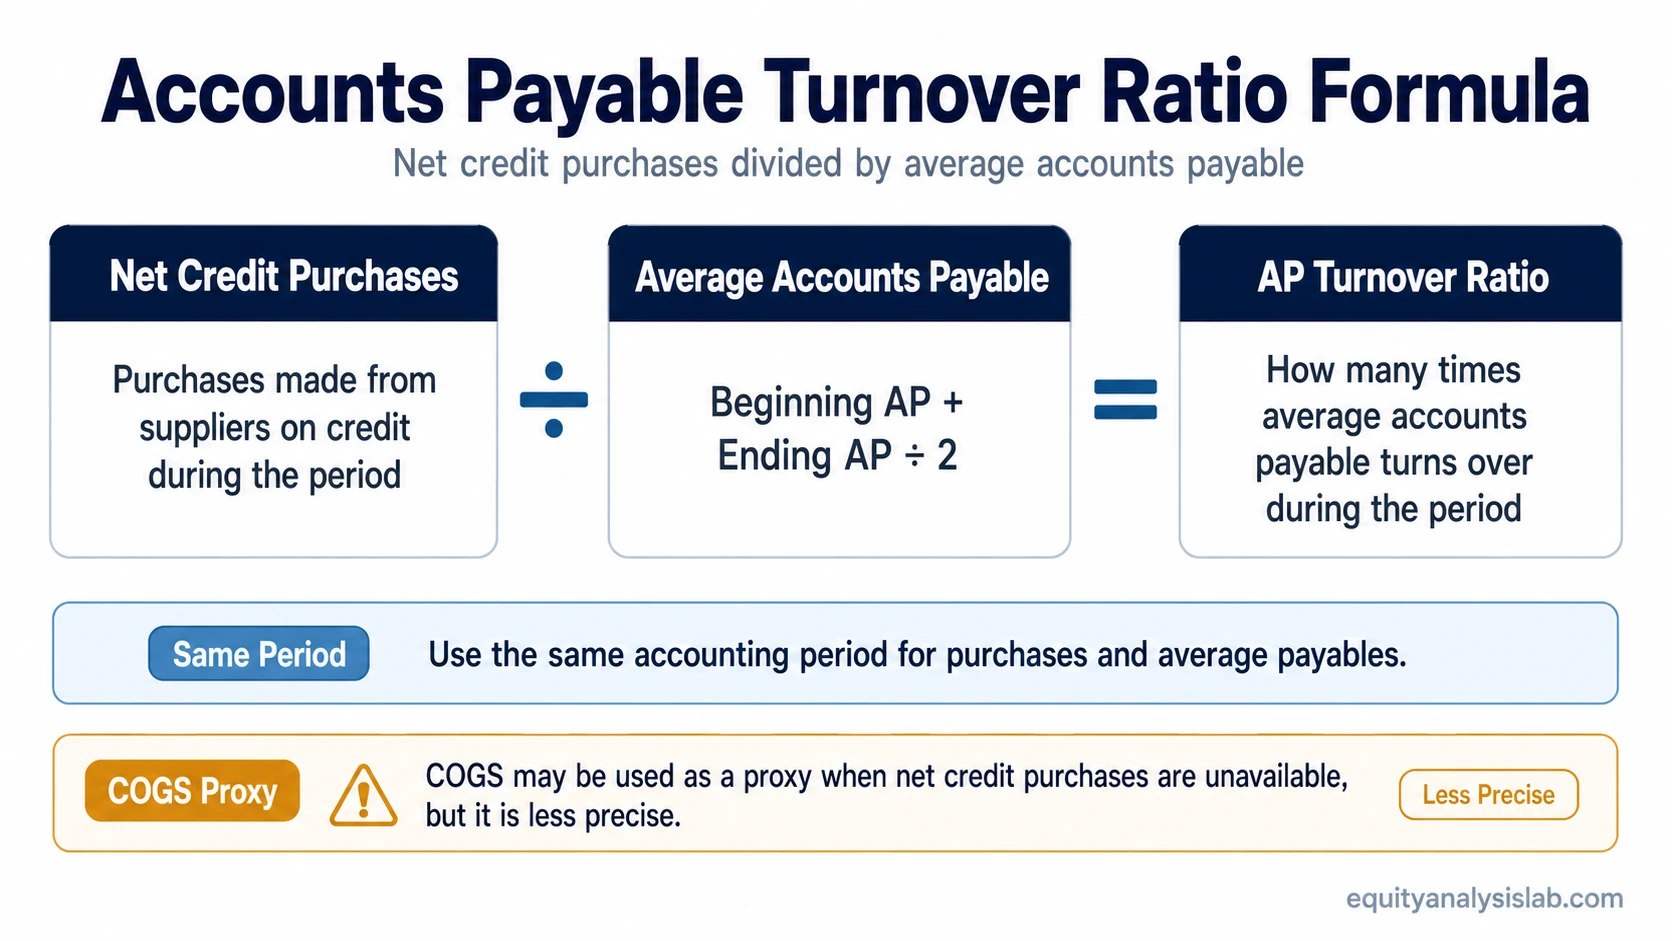
- The main formula is net credit purchases divided by average accounts payable.
- Average accounts payable is normally calculated from beginning and ending accounts payable balances.
- A high ratio can reflect fast supplier payment, but it is not automatically positive.
- A low ratio can reflect slower payment, extended supplier terms, cash pressure, or deliberate working-capital management.
- The ratio should be interpreted with peers, trend, DPO, cash conversion cycle context, and operating cash flow.
Accounts Payable Turnover Ratio Formula
The standard formula is:
Accounts Payable Turnover Ratio = Net Credit Purchases ÷ Average Accounts Payable
Average accounts payable is usually calculated as:
Average Accounts Payable = (Beginning Accounts Payable + Ending Accounts Payable) ÷ 2
The numerator and denominator should cover the same accounting period. A full-year purchase figure should not be compared with a quarterly average payable balance unless the data has been adjusted consistently.
| Formula input | What it means | Interpretation note |
|---|---|---|
| Net credit purchases | Purchases made from suppliers on credit during the period. | This is the cleaner numerator when the data is available. |
| Supplier credit purchases | Another wording for purchases made on supplier credit. | The same period should be used as the accounts payable average. |
| Average accounts payable | The average supplier amount owed during the period. | Using only ending AP can distort the result if the balance is seasonal or unusually high or low. |
| COGS proxy | Cost of goods sold may be used when net credit purchases are unavailable. | COGS is less precise because it is not the same as supplier credit purchases. |
How to Calculate Accounts Payable Turnover
This is an illustrative example, not a real company case. Assume a company reports the following figures for the year:
| Input | Amount |
|---|---|
| Net credit purchases | $2,000,000 |
| Beginning accounts payable | $400,000 |
| Ending accounts payable | $500,000 |
First calculate average accounts payable:
Average accounts payable = ($400,000 + $500,000) ÷ 2 = $450,000
Then calculate the accounts payable turnover ratio:
Accounts payable turnover ratio = $2,000,000 ÷ $450,000 = 4.4x
A result of 4.4x means the company paid down its average accounts payable balance about 4.4 times during the period. The number becomes more useful when compared with prior years and with companies that have similar supplier terms and industry economics.
How to Interpret a Higher or Lower Accounts Payable Turnover Ratio
A higher ratio usually means the company is paying suppliers more quickly. A lower ratio usually means the company is paying suppliers more slowly. Neither result is automatically good or bad without context.
| Ratio pattern | Possible interpretation | What to check next |
|---|---|---|
| Higher AP turnover | The company may be paying suppliers quickly, using less supplier financing, or maintaining conservative payment behavior. | Check whether fast payment reflects strong cash flow, early-payment discounts, weak bargaining power, or unusually short supplier terms. |
| Lower AP turnover | The company may be taking longer to pay suppliers, using supplier credit more heavily, or facing payment pressure. | Check whether slower payment reflects negotiated terms, cash stress, seasonality, or a working-capital strategy. |
| Rising ratio over time | The company is paying suppliers faster than before, or average payables have become smaller relative to purchases. | Compare the change with operating cash flow, supplier terms, inventory behavior, and purchasing volume. |
| Falling ratio over time | The company is paying suppliers more slowly, or accounts payable has grown relative to purchases. | Check whether the change is intentional working-capital management or a sign of liquidity strain. |
The safest interpretation is comparative. A retailer, manufacturer, software company, and distributor can have very different supplier-payment patterns, so cross-industry comparisons can be misleading.
Accounts Payable Turnover Ratio vs DPO
Accounts payable turnover and days payable outstanding look at the same supplier-payment behavior from different angles. AP turnover shows how many times accounts payable turns over during a period. DPO, or AP days, expresses the result as an estimated number of days.
DPO = 365 ÷ Accounts Payable Turnover Ratio
Using the rounded illustrative 4.4x turnover result above:
DPO = 365 ÷ 4.4 = about 83 days
The relationship is inverse. A higher AP turnover ratio generally means lower DPO, while a lower AP turnover ratio generally means higher DPO. DPO should remain a supporting interpretation tool here, not the main topic of the page.
What Changes the Interpretation?
The same accounts payable turnover ratio can mean different things depending on the company’s business model, supplier relationships, cash flow, and timing of purchases.
| Context factor | Why it matters | Investor interpretation |
|---|---|---|
| Supplier terms | Some companies have naturally longer or shorter payment windows. | A low ratio may be normal if suppliers grant extended terms. |
| Industry model | Inventory-heavy and supplier-heavy companies can have different payable cycles than asset-light businesses. | Peer comparison is usually more useful than a universal threshold. |
| Bargaining power | Companies with stronger supplier leverage may be able to negotiate longer payment periods. | Slower payment is not automatically distress if terms are negotiated and stable. |
| Seasonal AP balances | Accounts payable can spike before or after seasonal purchase periods. | Average AP helps, but unusual seasonality may still distort the ratio. |
| One-off purchases | A large purchasing event can temporarily change credit purchases or payable balances. | One period should not be overread without checking trend and notes. |
| Changes in purchase volume | Growth or contraction in purchasing can change the numerator quickly. | Separate operating expansion from payment-timing changes. |
| Operating cash flow | A company can delay payments to preserve cash even if reported earnings look stable. | Read AP turnover alongside cash flow, not only the income statement. |
| Cash conversion cycle | Payables interact with inventory and receivables timing. | AP turnover is one part of working-capital interpretation, not the whole cycle. |
Common Mistakes When Reading AP Turnover
- Using ending AP instead of average AP: ending accounts payable can be distorted by seasonality, a recent purchasing cycle, or one large supplier invoice.
- Treating a high ratio as automatically good: fast supplier payment may reflect strong cash flow, but it may also show limited supplier credit or weak negotiating power.
- Treating a low ratio as automatically bad: slower payment may reflect cash pressure, but it may also reflect normal supplier terms or deliberate working-capital management.
- Comparing unlike industries: supplier intensity, inventory needs, and payment terms vary widely across business models.
- Ignoring cash-flow context: AP turnover should be checked against operating cash flow, working-capital changes, and the company’s broader liquidity position.
When COGS Is Used Instead of Net Credit Purchases
Net credit purchases are the cleaner numerator because the ratio is meant to compare supplier credit purchases with accounts payable. In practice, companies do not always disclose net credit purchases separately.
When that data is unavailable, analysts sometimes use cost of goods sold as a proxy. This can be useful for a rough comparison, but it is less precise because COGS can include cost recognition that does not perfectly match supplier credit purchases during the period.
Data-quality note: if one company’s ratio uses net credit purchases and another company’s ratio uses COGS, the comparison may not be exact. The input choice should be consistent when comparing peers or tracking a company over time.
How Investors Can Use the Ratio
Accounts payable turnover is most useful when it helps explain a company’s working-capital behavior. It can support questions such as whether the company is paying suppliers faster or slower, whether payment behavior is changing, and whether cash flow supports the reported operating picture.
The ratio should be read with related efficiency and working-capital metrics. Accounts receivable turnover ratio looks at customer collection speed, while inventory turnover ratio helps show how quickly inventory moves through the business.
Working capital turnover ratio gives a broader view of how efficiently the company uses net working capital to support revenue. Together, these metrics can help investors separate a normal operating pattern from a possible change in liquidity, supplier pressure, purchasing discipline, or cash conversion quality.
FAQ
Is a high accounts payable turnover ratio good?
Not always. A high accounts payable turnover ratio can reflect strong liquidity and prompt supplier payment, but it can also indicate limited supplier credit, short payment terms, or weak bargaining power. It should be compared with peers, trend, supplier terms, and operating cash flow.
What is the difference between accounts payable turnover and DPO?
Accounts payable turnover shows how many times average accounts payable is paid down during a period. DPO converts that payment behavior into an estimated number of days using the formula 365 divided by the accounts payable turnover ratio.
Can COGS be used instead of net credit purchases?
COGS can be used as a proxy when net credit purchases are unavailable, but it is less precise. Net credit purchases are the cleaner numerator because they better match the supplier-credit behavior that accounts payable turnover is trying to measure.
Why use average accounts payable?
Average accounts payable reduces the risk of basing the ratio on a single balance-sheet date. Ending accounts payable may be unusually high or low because of seasonality, one-off purchases, or timing of supplier invoices.