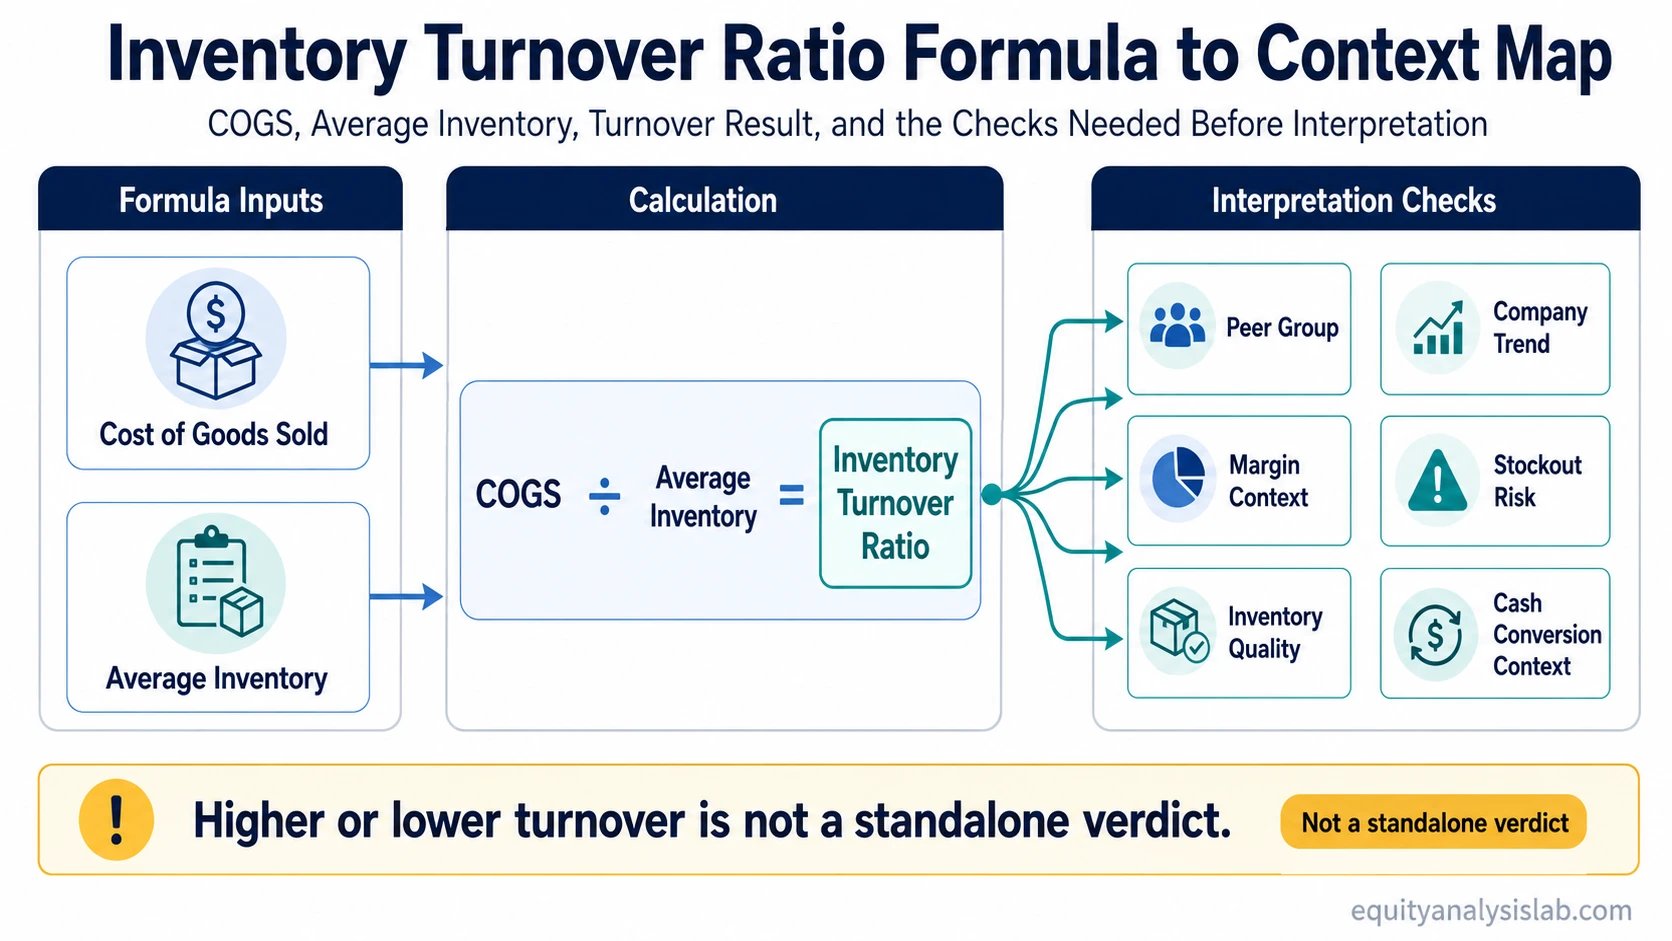
Inventory turnover ratio is an operating-efficiency ratio that compares cost of goods sold with average inventory to estimate how often a company sells and replaces inventory during a period. A higher or lower ratio is not a standalone verdict; investors need to compare it with industry norms, company trend, margin context, inventory risk, and cash-conversion support.
Definition: Inventory turnover ratio measures how many times average inventory is sold and replaced during a reporting period, using cost of goods sold as the numerator and average inventory as the denominator.
Key Points
- Inventory turnover ratio is usually calculated as cost of goods sold divided by average inventory.
- Average inventory is commonly estimated as beginning inventory plus ending inventory, divided by two.
- A high ratio can point to fast inventory movement, but it can also reflect lean inventory, stockout risk, or product availability pressure.
- A low ratio can point to slow-moving inventory, but interpretation depends on industry model, seasonality, product cycle, and company strategy.
- The ratio is most useful when compared with peer companies, the company’s own trend, margins, and working-capital context.
What Is the Inventory Turnover Ratio?
Inventory turnover ratio shows the relationship between the inventory a company holds and the cost base tied to goods it sells. It is most relevant for businesses where inventory is a meaningful balance sheet item, such as retailers, manufacturers, distributors, and many consumer product companies.
The ratio does not measure revenue directly. It uses cost of goods sold, often shortened to COGS, because inventory is carried at cost rather than at the final sales price. That makes the ratio a closer match between the cost of inventory held and the cost of inventory moved through the income statement.
For investor analysis, inventory turnover ratio is a diagnostic metric. It can help identify whether inventory is moving efficiently, building up, shrinking too aggressively, or changing in a way that deserves comparison with margins, sales growth, and cash flow. It should not be treated as proof of business quality or as a stock-selection rule.
Inventory Turnover Ratio Formula
The standard inventory turnover ratio formula is:
Inventory turnover ratio = Cost of goods sold / Average inventory
If a company reports $800 million of cost of goods sold and average inventory of $200 million, the inventory turnover ratio is 4.0 times. That means the company sold and replaced inventory about four times during the period measured by the inputs.
| Formula input | What it represents | Typical statement source |
|---|---|---|
| Cost of goods sold | The cost base attached to goods sold during the period | Income statement |
| Beginning inventory | Inventory reported at the start of the period | Balance sheet or prior-period balance sheet |
| Ending inventory | Inventory reported at the end of the period | Balance sheet |
| Average inventory | A period estimate of inventory held during the period | Calculated from inventory balances |
| Period length | The reporting period being analyzed, such as a quarter or fiscal year | Financial statement period |
How to Calculate Average Inventory
Average inventory smooths the beginning and ending inventory balances so the denominator is not based only on one balance sheet date. The common formula is:
Average inventory = (Beginning inventory + Ending inventory) / 2
For example, if beginning inventory is $180 million and ending inventory is $220 million, average inventory is $200 million. If cost of goods sold is $800 million, the inventory turnover ratio is:
Example calculation: $800 million COGS / $200 million average inventory = 4.0 times inventory turnover.
More detailed analysis may use monthly or quarterly inventory averages when inventory levels swing materially during the year. A simple beginning-and-ending average can be distorted when the business is highly seasonal or when inventory changes sharply near the reporting date.
Where the Inputs Come From in Financial Statements
The numerator and denominator come from different statements. Cost of goods sold is normally found on the income statement, while inventory appears on the balance sheet. That difference matters because the ratio combines a period flow item with a point-in-time balance sheet item.
| Input | Statement relationship | Investor check |
|---|---|---|
| Cost of goods sold | Period expense tied to goods sold | Compare gross margin movement while turnover changes. |
| Inventory | Balance sheet asset tied to goods not yet sold | Review whether inventory is rising faster or slower than sales and cost of sales. |
| Average inventory | Calculated balance estimate across the period | Test whether one balance sheet date is distorting the denominator. |
This statement cross-check prevents a common misread. A rising turnover ratio may look positive at first, but if gross margin is falling, inventory availability is strained, or sales growth is being supported by discounting, the headline ratio can overstate the quality of the operating signal.
How to Interpret High and Low Inventory Turnover
High and low inventory turnover are context-dependent. The same number can have different meanings in grocery retail, luxury goods, industrial equipment, apparel, auto parts, or specialty manufacturing.
| Observed pattern | Possible interpretation | Context check |
|---|---|---|
| High inventory turnover | Inventory may be moving quickly relative to inventory held. | Review whether customer demand, product availability, and margins remain healthy. |
| Very high inventory turnover | The company may be carrying too little inventory or facing stockout risk. | Look for signs that sales are being constrained or service levels are deteriorating. |
| Low inventory turnover | Inventory may be moving slowly or building up faster than sales. | Check product cycle, seasonality, demand changes, and write-down risk. |
| Improving turnover | Inventory productivity may be improving. | Compare the improvement with margin stability and cash conversion. |
| Deteriorating turnover | Inventory may be becoming less productive. | Review whether sales growth is slowing, inventory is aging, or demand assumptions changed. |
A high inventory turnover ratio is not automatically good. It can indicate efficient inventory movement, but it can also indicate understocking, aggressive discounting, or insufficient inventory to support demand. A low inventory turnover ratio is not automatically bad either; some business models naturally carry more inventory because products are expensive, customized, seasonal, or slow-cycle.
Why Peer Group and Company Trend Matter
Inventory turnover ratio is strongest when it is compared in two directions: against similar companies and against the same company’s own history. Cross-industry comparisons are often weak because inventory economics differ widely across business models.
A retailer with fast-moving consumable goods may normally show much higher turnover than a manufacturer of specialized equipment. That does not automatically make the retailer a better business. It means the inventory model is different.
Investor context checklist: Before interpreting the ratio, compare the result with the company’s peer group, prior periods, revenue trend, gross margin, inventory balance, working-capital movement, and operating cash-flow support.
Trend analysis can reveal changes that a single number hides. If turnover improves while revenue grows and margins remain stable, the signal may be more useful. If turnover improves because inventory was cut too aggressively, future sales may face availability pressure. If turnover falls while inventory grows faster than sales, the next check is whether demand has slowed or inventory quality has weakened.
Inventory Turnover Ratio Example
A hypothetical company reports the following annual figures:
| Item | Amount | Calculation role |
|---|---|---|
| Beginning inventory | $150 million | Used to calculate average inventory |
| Ending inventory | $250 million | Used to calculate average inventory |
| Average inventory | $200 million | ($150 million + $250 million) / 2 |
| Cost of goods sold | $900 million | Numerator in the turnover ratio |
| Inventory turnover ratio | 4.5 times | $900 million / $200 million |
A 4.5 times inventory turnover ratio means the company sold and replaced average inventory about 4.5 times during the period. The number becomes meaningful only after comparison. If similar companies turn inventory 7 times, the company may be slower than peers. If its own prior-year ratio was 3 times and margins stayed stable, the trend may point to better inventory productivity.
A 4.5 times result is not good or bad by itself. The correct interpretation depends on product type, business model, seasonality, pricing, inventory quality, and cash-flow support.
Limitations and Common Mistakes
Inventory turnover ratio can be useful, but it is easy to overread because the formula compresses several operating and accounting realities into one number.
Limitation: A single inventory turnover result does not show whether inventory is fresh or obsolete, whether margins are protected, whether stockouts are hurting sales, or whether the company is managing working capital sustainably.
| Risk or limitation | Why it matters | How to check it |
|---|---|---|
| Seasonality | Inventory can rise before peak selling periods and fall after them. | Compare the same quarter across years, not only sequential periods. |
| Inventory write-downs | Write-downs can change inventory balances and signal weaker inventory quality. | Review gross margin movement and inventory-related disclosures when available. |
| Stockout risk | Very lean inventory can make turnover look high while limiting future sales. | Check revenue growth, backlog, customer demand, and margin behavior. |
| Accounting classification | Input definitions may differ across companies and industries. | Compare companies with similar business models and reporting structures. |
| Cash-conversion mismatch | Inventory movement is only one part of working-capital timing. | Compare turnover with receivables, payables, and operating cash-flow trends. |
Common mistake: Treating a higher inventory turnover ratio as automatically better can hide inventory shortages, discounting pressure, or a business model that simply carries less inventory by design.
Inventory Turnover, DIO, and Cash Conversion Context
Inventory turnover ratio measures frequency. Days inventory outstanding translates inventory movement into an estimated number of days inventory is held. The two ideas are related, but they answer the question from different angles.
Cash conversion context is broader. Inventory movement is only one part of the working-capital cycle. Customer collection timing and supplier-payment timing can change the cash-flow interpretation even when inventory turnover looks stable.
For example, fast inventory turnover can look efficient, but if receivables collection slows or suppliers are being paid much faster, the cash-conversion picture may not improve. That is why inventory turnover should be read alongside related operating-efficiency metrics rather than used as a standalone verdict.
Related Operating Efficiency Ratios
Inventory turnover ratio focuses on inventory movement, but operating efficiency analysis usually needs nearby ratios to separate inventory, customer collection, supplier-payment timing, and broader working-capital productivity.
| Related ratio | What it focuses on | How it differs from inventory turnover |
|---|---|---|
| accounts receivable turnover | Customer collection efficiency | It focuses on receivables and collections, not inventory sold and replaced. |
| accounts payable turnover ratio | Supplier-payment timing | It focuses on how quickly a company pays suppliers, not how quickly inventory moves. |
| working-capital productivity | Revenue relative to working capital | It uses a broader working-capital base rather than isolating inventory. |
These ratios should not be collapsed into one score. Inventory, receivables, payables, and working capital each reveal a different part of the operating cycle.
FAQ
What is inventory turnover ratio?
Inventory turnover ratio is an operating-efficiency ratio that compares cost of goods sold with average inventory to estimate how often inventory is sold and replaced during a period.
What is the inventory turnover ratio formula?
The standard formula is cost of goods sold divided by average inventory. Average inventory is commonly calculated as beginning inventory plus ending inventory, divided by two.
Is a high inventory turnover ratio always good?
No. A high ratio can indicate fast inventory movement, but it can also reflect too little inventory, stockout risk, discounting pressure, or a business model that naturally carries less inventory.
Is a low inventory turnover ratio always bad?
No. A low ratio can signal slow-moving inventory or demand weakness, but some industries naturally carry more inventory because products are seasonal, expensive, customized, or slow-cycle.
Why should inventory turnover be compared within the same industry?
Industry comparison matters because inventory economics differ across business models. A grocery retailer, luxury goods company, industrial manufacturer, and equipment distributor can have very different normal inventory turnover levels.