Working capital turnover ratio measures how much net sales a company generates for each unit of average working capital used during a period. It connects sales from the income statement with working capital from the balance sheet, usually calculated as current assets minus current liabilities.
Definition: Working capital turnover ratio is an efficiency ratio that compares net sales with average working capital. A higher ratio means the company generated more sales per unit of working capital, while a lower ratio means more working capital was tied up relative to sales.
The ratio is most useful when the denominator is measured consistently. Working capital can move sharply from one balance sheet date to another, so using an average working capital figure usually gives a cleaner view than using only the ending balance.
Key Points
- Working capital turnover ratio compares net sales with average working capital or average net working capital.
- The numerator usually comes from the income statement, while the denominator is built from balance sheet accounts.
- A high ratio can suggest efficient working-capital use, but it can also reflect a very small denominator, stretched payables, or underinvestment.
- A low ratio can suggest inefficient working-capital use, but it may also reflect a business model that needs larger inventories, receivables, or liquidity buffers.
- The ratio works best when compared with peers, historical trends, cash generation, and related operating-efficiency metrics.
What Working Capital Turnover Ratio Means
Working capital turnover ratio relates net sales to the short-term capital tied up in operations. It does not measure profit, cash flow, solvency, or shareholder return by itself. It measures the relationship between revenue activity and the short-term operating capital tied up in the business.
For example, a retailer, distributor, or manufacturer may need inventory, receivables, and supplier credit to support sales. The working capital turnover ratio compresses those moving parts into one sales-efficiency measure. The result can help compare how much revenue similar companies generate from their working-capital base.
The ratio becomes more meaningful when it is part of broader working capital analysis. A company can show strong sales relative to working capital while still having weak cash conversion, poor receivables quality, or supplier-payment pressure.
Working Capital Turnover Ratio Formula
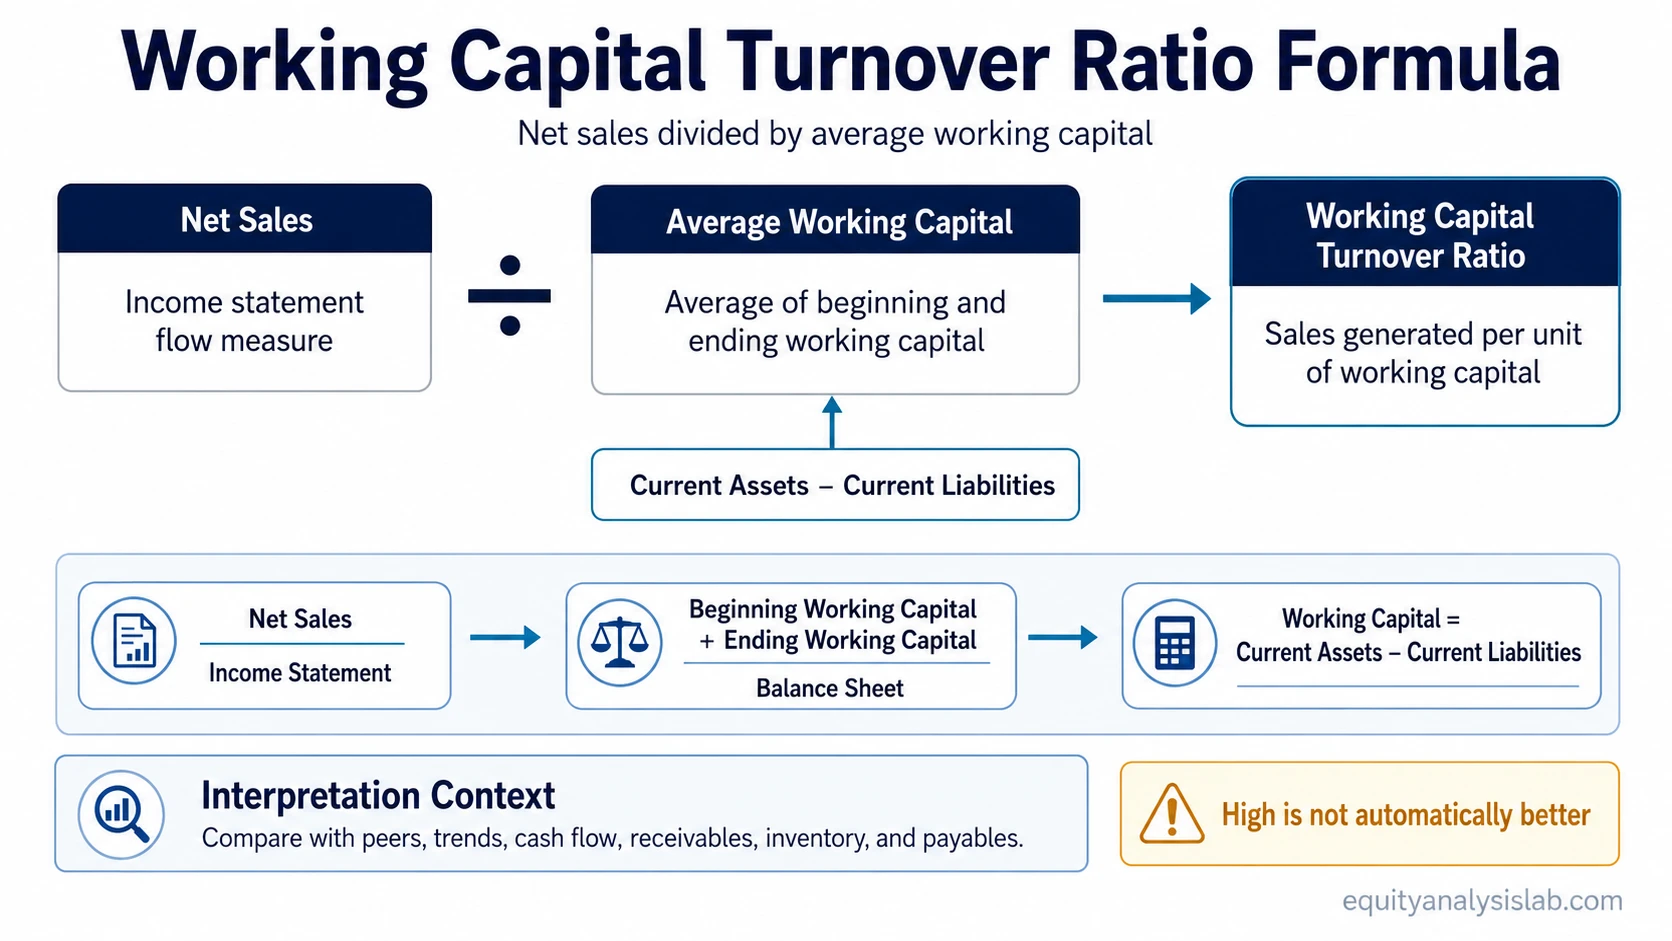
The most common formula is:
Working Capital Turnover Ratio = Net Sales ÷ Average Working Capital
Average working capital is usually calculated as:
Average Working Capital = (Beginning Working Capital + Ending Working Capital) ÷ 2
Working capital is commonly defined as:
Working Capital = Current Assets − Current Liabilities
Some analysts use average net working capital, and some refine the denominator toward operating working capital. The important point is consistency: the numerator should cover the same period as the average denominator, and the same classification method should be used when comparing companies or time periods.
Where the Inputs Come From
The ratio combines one flow measure with one balance-sheet base. Net sales cover activity during the period. Working capital is a balance-sheet position at a point in time, so beginning and ending balances are usually averaged to match the sales period more closely.
| Input | Statement source | What to check | Interpretation risk |
|---|---|---|---|
| Net sales | Income statement | Use the sales figure for the same period as the working-capital average. | Gross sales, revenue, and net sales may not be identical depending on reporting and deductions. |
| Current assets | Balance sheet | Identify cash, receivables, inventory, and other current assets. | Excess cash can make working capital look larger even if it is not needed for operations. |
| Current liabilities | Balance sheet | Identify payables, accrued expenses, short-term debt, and other current obligations. | Short-term debt and unusual liabilities can distort an operating-efficiency reading. |
| Average working capital | Beginning and ending balance sheets | Average the opening and closing working-capital balances for the period. | A single balance sheet date can be distorted by seasonality, acquisitions, one-time payments, or quarter-end effects. |
For operating analysis, some analysts adjust the denominator by excluding excess cash, marketable securities, or short-term financing items. That adjustment can make the ratio more focused on operating working capital, but it also requires clear methodology. Mixing adjusted and unadjusted versions can make peer comparisons unreliable.
Working Capital Turnover Ratio Example
Example: Suppose a company reports net sales of $120 million. Its working capital was $28 million at the beginning of the year and $32 million at the end of the year.
First, calculate average working capital:
Average Working Capital = ($28 million + $32 million) ÷ 2 = $30 million
Then divide net sales by average working capital:
Working Capital Turnover Ratio = $120 million ÷ $30 million = 4.0x
A 4.0x ratio means the company generated four dollars of net sales for every dollar of average working capital during the period. The number is not automatically good or bad. It needs context from margins, cash flow, inventory movement, receivable collection, payable timing, seasonality, and peer norms.
How to Interpret a High or Low Ratio
A higher working capital turnover ratio can indicate that a company is using working capital efficiently. It may be converting inventory, receivables, and supplier financing into sales without holding excessive short-term assets.
A high ratio can also be a warning if the denominator is unusually low. A company may show a very high result because it carries too little inventory, delays payments to suppliers, relies heavily on customer prepayments, or operates with negative working capital. In those cases, the ratio may reflect business model structure or balance-sheet pressure rather than superior efficiency.
A lower ratio can indicate that too much working capital is tied up relative to sales. That can happen when inventory builds faster than demand, receivables take longer to collect, or current assets expand without a matching increase in revenue.
A low ratio can also be normal for businesses that require larger inventories, longer production cycles, or more customer credit. Capital intensity, seasonality, supplier terms, and business model design can all change what “high” or “low” means.
| Ratio pattern | Possible interpretation | What to check next |
|---|---|---|
| Rising ratio | Sales are growing faster than average working capital. | Check whether cash flow and service levels support the improvement. |
| Falling ratio | Working capital is growing faster than sales. | Check receivables aging, inventory buildup, and demand conditions. |
| Very high ratio | The company may be efficient, or the denominator may be unusually small. | Check negative working capital, stretched payables, low inventory, and business model differences. |
| Very low ratio | The company may be tying up too much capital in operations. | Check seasonality, industry norms, growth investment, and working-capital quality. |
When the Ratio Can Mislead
Working capital turnover ratio can mislead when it is read as a simple efficiency score. The same ratio can mean different things across industries, balance-sheet structures, and business models.
Common mistake: Treating a high ratio as automatically better. A high ratio may reflect lean working-capital use, but it can also come from a low or negative denominator, supplier-payment pressure, or underinvestment in inventory and customer service capacity.
Limitation: The ratio uses accounting balances, not direct cash generation. Sales efficiency should be cross-checked against operating cash flow, receivable quality, inventory movement, and payable behavior before drawing a stronger conclusion.
Negative working capital needs careful handling. Some businesses operate successfully with negative working capital because customers pay before suppliers must be paid. Others show negative working capital because liquidity is tight. The ratio alone cannot separate those cases.
Seasonality can also distort the denominator. A company with a large inventory build before peak selling season may look less efficient at one date and more efficient after inventory converts to sales. Average balances help, but they do not remove all timing effects.
How It Connects to Other Operating Efficiency Metrics
Working capital turnover ratio gives a broad sales-to-working-capital view. The underlying drivers usually come from receivables, inventory, payables, and cash conversion timing.
| Related metric | What it adds | How it complements working capital turnover |
|---|---|---|
| Cash conversion cycle | Shows the time between cash leaving the business and cash returning through sales collection. | Helps explain whether working capital efficiency is improving through faster cash movement or delayed payments. |
| Operating cash flow ratio | Compares operating cash flow with current liabilities. | Helps test whether sales efficiency is supported by cash coverage. |
| Accounts receivable turnover ratio | Shows how quickly receivables are converted into collected sales. | Helps identify whether sales are turning into collectible receivables efficiently. |
| Inventory turnover ratio | Shows how quickly inventory moves through the business. | Helps explain whether working capital is tied up in slow-moving inventory. |
| Accounts payable turnover ratio | Shows how quickly suppliers are being paid. | Helps identify whether working-capital efficiency is being helped by longer supplier payment timing. |
These metrics should not be forced into one ranking. A company can improve working capital turnover while weakening supplier relationships, reducing inventory too aggressively, or collecting receivables more slowly. The better interpretation comes from the pattern across the full operating cycle.
What Counts as a Good Working Capital Turnover Ratio?
A good working capital turnover ratio depends on the industry, business model, seasonality, and accounting classification. A grocery retailer, software company, manufacturer, distributor, and subscription business can all have very different working-capital structures.
The strongest benchmark is usually a peer group with similar business economics. A ratio that looks low in one industry may be normal in another. A ratio that looks high may be sustainable for one model but risky for another.
Trend analysis is also important. A stable or improving ratio can be constructive when sales quality, margins, and cash flow remain healthy. A sudden jump needs more caution if it comes from a shrinking working-capital base rather than stronger operating performance.
Practical Investor Checks
Check the denominator: Confirm whether the calculation uses total working capital, net working capital, or adjusted operating working capital.
Match the time period: Use sales for the same period covered by beginning and ending working-capital balances.
Compare peers carefully: Use companies with similar inventory models, credit terms, supplier relationships, and revenue recognition patterns.
Check cash support: Strong sales relative to working capital is more useful when operating cash flow and receivable quality support the result.
Look for pressure points: A high ratio can hide stretched payables, thin inventory buffers, or negative working capital that may not be durable.
The ratio is most useful as a diagnostic measure, not a standalone conclusion. It can point toward efficient short-term capital use, but the investment interpretation depends on cash generation, margins, balance-sheet quality, and the company’s operating model.
FAQ
What is the working capital turnover ratio?
Working capital turnover ratio is an efficiency ratio that compares net sales with average working capital. It shows how much sales a company generates for each unit of working capital used during the period.
What is the formula for working capital turnover ratio?
The common formula is net sales divided by average working capital. Average working capital is usually calculated by adding beginning working capital and ending working capital, then dividing by two.
Is a higher working capital turnover ratio always better?
No. A higher ratio can suggest efficient working-capital use, but it can also reflect a very small denominator, negative working capital, stretched supplier payments, or underinvestment in inventory and operating capacity.
Can working capital turnover ratio be negative?
Yes. The ratio can become negative when working capital is negative, meaning current liabilities exceed current assets. That result needs careful interpretation because negative working capital can be normal for some business models and risky for others.