Accounts receivable turnover ratio compares net credit sales with average accounts receivable to estimate how often a company turns receivables into collected sales during a period. A higher reading can point to faster collection, but it is not automatically better; investors need credit terms, customer mix, receivables quality, peer norms, and cash-flow confirmation before drawing conclusions.
Definition: Accounts receivable turnover ratio is an operating-efficiency ratio that measures net credit sales divided by average accounts receivable. It shows how many times a company converts its average receivables balance into credit-sales collection activity during the period.
Key Points
- The ratio uses net credit sales in the numerator and average accounts receivable in the denominator.
- It is an operating-efficiency ratio, not a standalone verdict on business quality or investment attractiveness.
- Higher turnover may suggest faster collection, but credit terms, customer mix, industry norms, and receivables quality can change the interpretation.
- Lower turnover may reflect slower collection, lenient credit terms, disputed invoices, customer stress, or timing differences.
- Investors should cross-check the result with operating cash flow, receivables aging, allowances, and multi-period trend data where available.
What Accounts Receivable Turnover Ratio Measures
Accounts receivable turnover ratio measures the relationship between a company’s credit sales and the receivables it carries on the balance sheet. In plain terms, it asks how efficiently the company turns customer credit into collected revenue activity during a reporting period.
The metric belongs to the operating-efficiency and activity-ratio family. It is most useful when an investor wants to understand whether revenue is being supported by collectible receivables or whether reported sales are building up faster than cash collection.
The main mistake is reading the headline number as a quality score. High receivables turnover can reflect disciplined collection, but it can also reflect short customer credit terms, a cash-heavy business model, seasonal balance-sheet timing, or a smaller receivables base at period end. Low turnover can signal collection pressure, but it can also reflect normal credit terms in an industry where customers pay later.
Investor interpretation note: The ratio is a starting point for questions, not a verdict on business quality. The stronger reading comes from combining the result with peer comparison, trend direction, receivables quality, allowances, and cash-flow conversion.
Accounts Receivable Turnover Ratio Formula
The accounts receivable turnover ratio formula is:
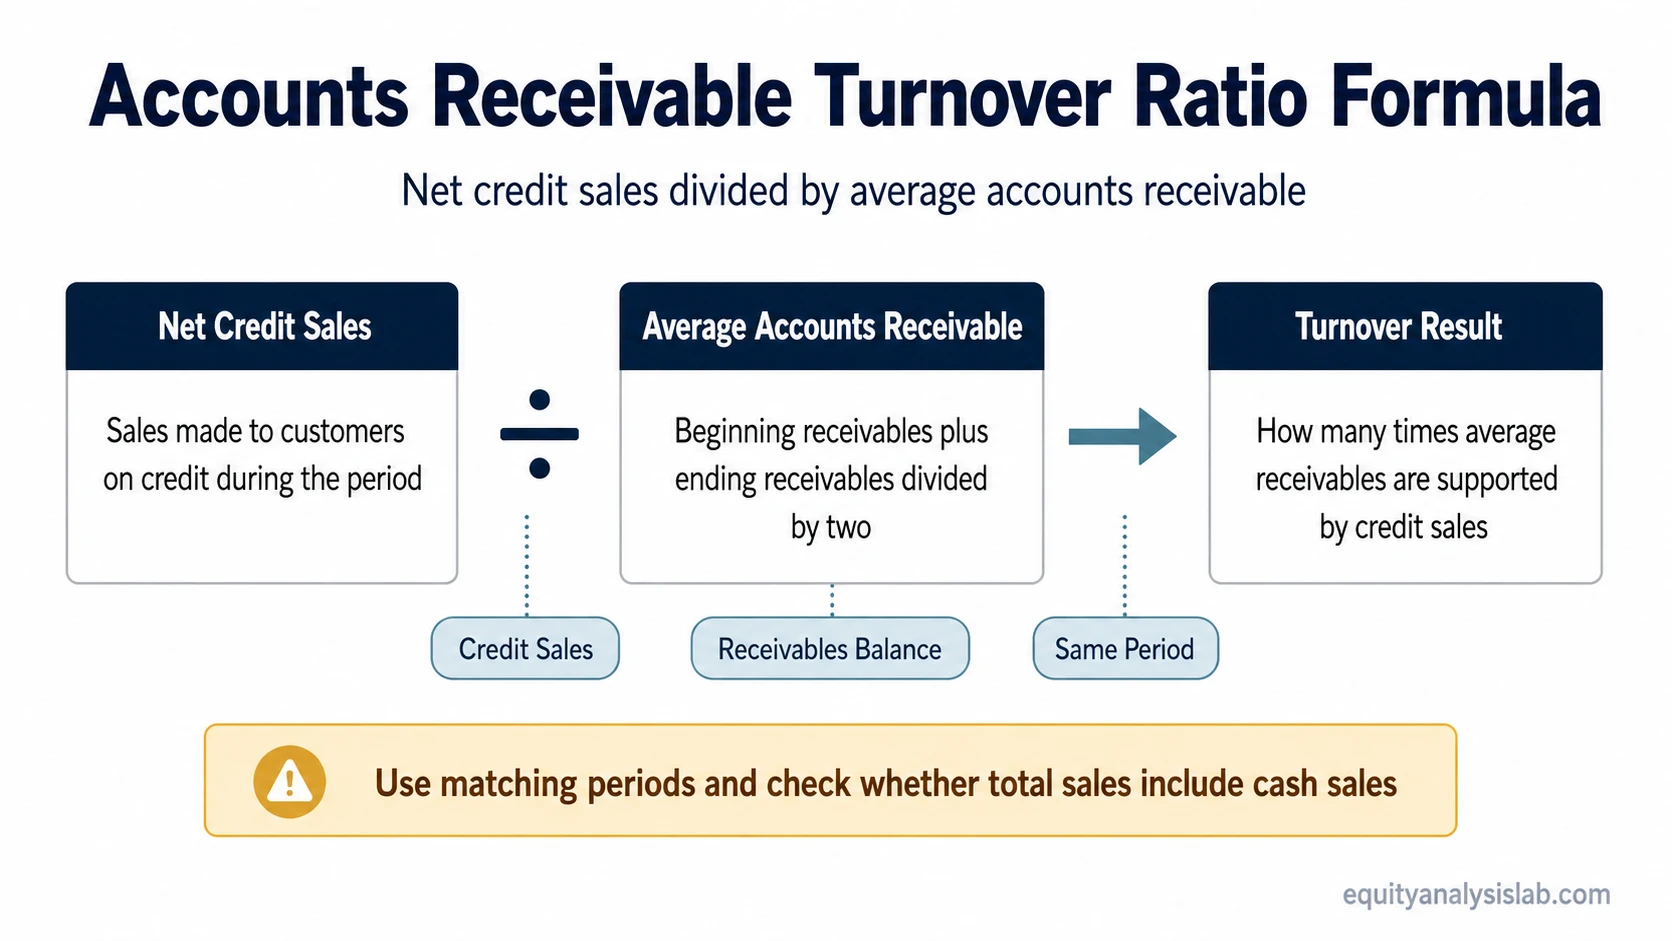
Accounts receivable turnover ratio = Net credit sales ÷ Average accounts receivable
Net credit sales are the sales made to customers on credit during the period, usually after returns, allowances, and discounts where those adjustments are disclosed. Average accounts receivable is usually calculated as beginning accounts receivable plus ending accounts receivable, divided by two.
The sales input comes from revenue or sales disclosures when credit-sales detail is available, while the receivables input comes from the balance sheet.
The numerator and denominator should match the same accounting period. Using annual credit sales with a quarter-end receivables balance, or using total sales when cash sales are material, can make the calculation look cleaner than the underlying collection picture.
| Formula input or reading | What it means | What can distort it | What investors should check |
|---|---|---|---|
| Net credit sales | Sales made to customers on credit during the period. | Some companies disclose total net sales, not a clean credit-sales figure. Returns, allowances, discounts, and cash-sales mix can affect comparability. | Revenue notes, credit-sales disclosure if available, customer payment model, and whether cash sales are material. |
| Average accounts receivable | The average customer receivables balance over the period. | Beginning-and-ending averages can hide aging, seasonality, quarter-end collection pushes, or uneven sales timing. | Balance sheet trends, receivables aging if disclosed, allowance for doubtful accounts, and quarterly movement. |
| Period matching | The sales figure and receivables average should describe the same period. | Mismatched annual, quarterly, or point-in-time figures can create a misleading turnover rate. | Reporting period, fiscal-year timing, interim results, and whether trailing figures are being mixed with balance-sheet snapshots. |
| Headline turnover | The number of times average receivables are supported by credit sales during the period. | The figure can look strong even when collection quality is weak if the receivables balance is temporarily low or sales mix changes. | Peer norms, trend direction, customer concentration, operating cash flow, and receivables quality. |
How to Calculate Accounts Receivable Turnover Ratio
Illustrative example: If a company reports $10 million of net credit sales and $2 million of average accounts receivable, its accounts receivable turnover ratio is 5.0.
The calculation is:
$10 million ÷ $2 million = 5.0
A turnover ratio of 5.0 means the company generated five dollars of net credit sales for every dollar of average receivables during the period. It does not mean every invoice was collected five times, and it does not prove that all receivables are high quality. The 5.0 result becomes more useful when it is compared with the company’s credit terms, peer range, receivables aging, and operating cash flow.
For an investor, the next question is whether that turnover level fits the company’s credit terms, industry model, and cash-flow pattern. A calculation that improves while operating cash flow weakens may deserve more caution than one that improves alongside stable receivables quality and stronger cash conversion.
How Investors Interpret Higher and Lower Readings
Accounts receivable turnover ratio is most useful as a comparison tool. The same result can mean different things across industries, business models, and customer-payment structures. A subscription business, a distributor, a manufacturer, and a cash-heavy retailer may naturally carry different receivables profiles.
| Reading or change | What it may indicate | What to check next |
|---|---|---|
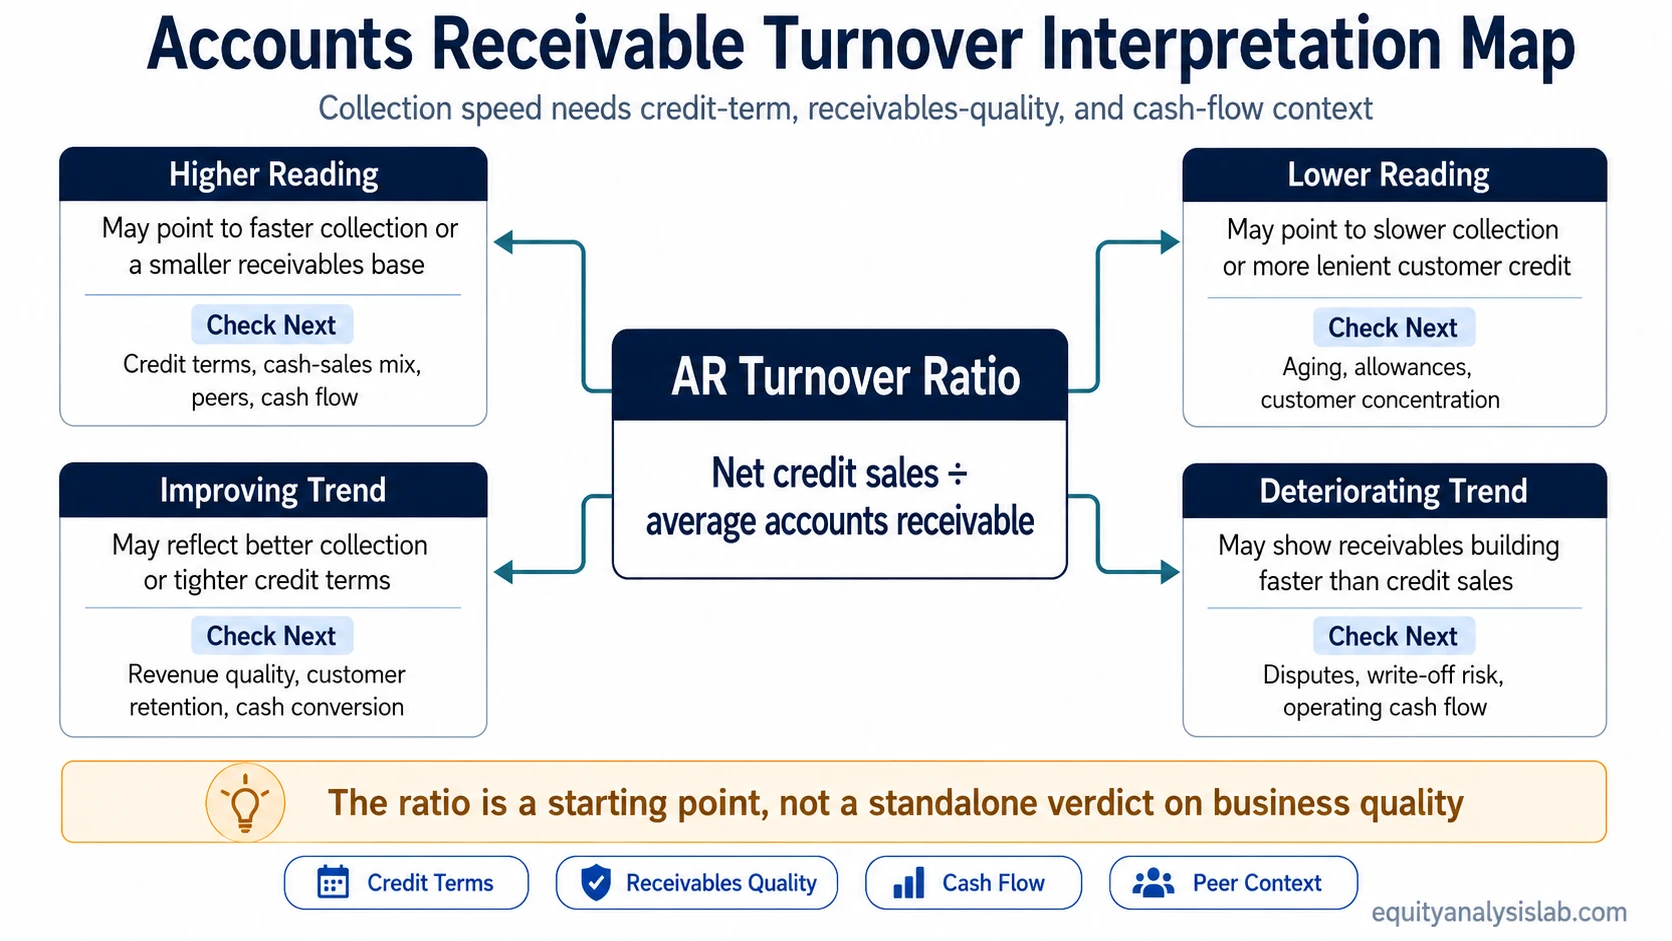
| Higher receivables turnover | The company may be collecting customer balances faster or carrying a smaller receivables base relative to credit sales. | Compare with peers, customer credit terms, cash-sales mix, seasonality, and operating cash flow. |
| Lower receivables turnover | The company may be collecting more slowly, extending more lenient credit, facing customer payment delays, or reporting sales before cash arrives. | Check receivables aging, allowance for doubtful accounts, customer concentration, and cash-flow conversion. |
| Improving turnover over several periods | Collection efficiency may be improving, or the company may be tightening credit terms. | Look for whether revenue growth, customer retention, and cash flow remain healthy after the change. |
| Deteriorating turnover over several periods | Receivables may be building faster than credit sales, which can point to slower collections or changing customer quality. | Review revenue recognition, disputed receivables, write-off risk, and whether operating cash flow is lagging net income. |
| Large one-period movement | The change may reflect seasonality, a major customer payment, acquisition effects, or reporting-date timing rather than a durable operating shift. | Use quarterly trend data, segment notes, customer concentration disclosures, and management commentary if available. |
A higher number is usually more encouraging when it appears alongside clean cash conversion, stable revenue quality, and reasonable customer terms. It is less useful when it comes from a temporarily compressed receivables balance or an incomplete credit-sales input.
Accounts Receivable Turnover Ratio and DSO
Accounts receivable turnover ratio and days sales outstanding describe the same collection relationship from different angles. Turnover shows frequency. DSO converts that relationship into an approximate number of days.
Days sales outstanding = 365 ÷ Accounts receivable turnover ratio
If the receivables turnover ratio is 5.0, the approximate DSO is 73 days. That means the company is taking about 73 days to convert credit sales into cash collection on average, using this simplified relationship.
DSO can be easier to interpret because it translates the ratio into time. Still, it has the same limitation: the result depends on the quality of the inputs, the business model, seasonality, and whether receivables are actually collectible. If the main question is collection days rather than turnover frequency, DSO should be analyzed directly instead of letting it take over this ratio.
What Accounts Receivable Turnover Ratio Can Hide
The ratio can look precise while still hiding important financial-statement risk. That is why investors should treat the headline number as an entry point into receivables quality rather than as the conclusion.
Common limitation: A company can report a reasonable accounts receivable turnover ratio while receivables aging worsens, allowances rise, or cash collection weakens. The ratio measures the relationship between credit sales and average receivables; it does not prove that every receivable is collectible.
| Potential issue | Why it matters | Investor cross-check |
|---|---|---|
| Total sales used instead of net credit sales | Cash sales do not create receivables, so including them can overstate turnover when the cash-sales mix is meaningful. | Check whether the company separates credit sales from total sales or whether an estimate is being used. |
| Average receivables hides aging | A simple beginning-and-ending average may not show whether old receivables are becoming harder to collect. | Look for receivables aging, bad-debt expense, allowance changes, and write-offs. |
| Seasonality | Receivables can rise or fall sharply around seasonal sales peaks, making a single-period ratio less representative. | Compare the same quarter across years and review multi-period trend data. |
| Industry credit terms | Some industries normally extend longer payment terms, so a lower ratio is not always a sign of poor collection. | Compare with peers that have similar business models and customer terms. |
| Customer concentration | A small number of large customers can make collections appear stable until one customer delays payment. | Review customer concentration disclosures and changes in large receivable balances. |
| Cash-flow mismatch | Revenue can grow while cash collection lags, especially if receivables expand faster than operating cash flow. | Compare receivables turnover with operating cash flow, free cash flow, and working-capital movement. |
The most useful interpretation sequence is formula input first, peer and trend comparison second, receivables quality third, and cash-flow confirmation last. That sequence keeps the ratio tied to economic reality instead of treating it as a standalone score.
How It Fits With Other Operating-Efficiency Ratios
Accounts receivable turnover ratio focuses on customer collection. It should not be confused with ratios that measure supplier payments, inventory movement, or broader working-capital productivity.
Related operating-efficiency context:
- Accounts payable turnover ratio looks at how often a company pays suppliers, which is the opposite side of the working-capital cycle from customer receivables.
- Inventory turnover ratio focuses on how efficiently inventory moves through the business, not how quickly customers pay invoices.
- Working capital turnover places receivables inside the broader question of how productively a company uses working capital to support sales.
Together, these ratios help investors separate different parts of the operating cycle. Receivables turnover is about collecting from customers, payable turnover is about paying suppliers, inventory turnover is about moving inventory, and working-capital turnover is about the productivity of the broader short-term asset base.
FAQ
Is a high accounts receivable turnover ratio always good?
No. A high ratio can suggest faster collection, but it can also reflect strict credit terms, a cash-heavy business model, seasonality, or a temporarily low receivables balance. Investors should compare the ratio with peers, trend data, receivables quality, and cash-flow conversion.
Why does the formula use net credit sales instead of total sales?
Net credit sales are used because accounts receivable comes from sales made on credit. Cash sales do not create receivables, so using total sales can distort the ratio when a company has a meaningful cash-sales mix.
How is accounts receivable turnover different from DSO?
Accounts receivable turnover shows collection frequency, while DSO translates the same relationship into an approximate number of days. A higher turnover ratio usually produces a lower DSO, but both measures depend on the quality of the inputs.