Days inventory outstanding estimates how many days a company holds inventory before it is sold. The ratio uses average inventory, cost of goods sold, and the length of the period to translate inventory into a days-based efficiency measure.
Definition: Days inventory outstanding, or DIO, measures the average number of days inventory remains on hand before moving through cost of goods sold. It is also called inventory days or days sales of inventory.
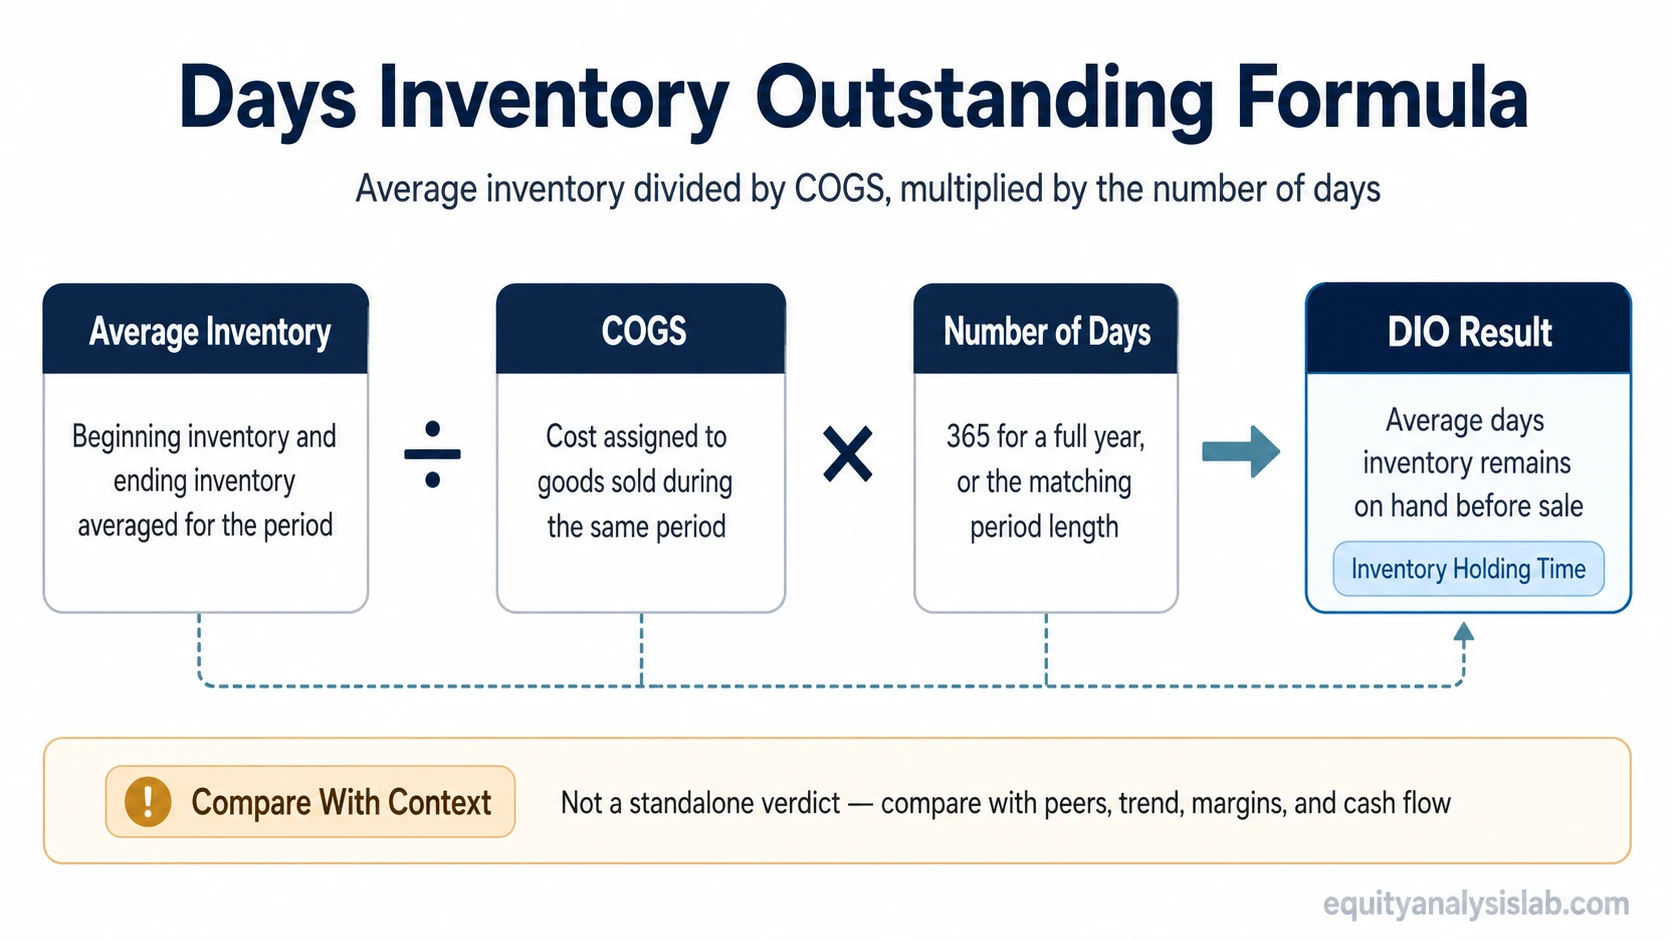
The core formula is average inventory divided by COGS, multiplied by the number of days in the period.
A lower or higher DIO reading is not automatically good or bad. The interpretation depends on the company’s industry, product cycle, demand pattern, accounting basis, and whether inventory movement is translating into cleaner working-capital conversion.
Key Points
- DIO estimates how long inventory stays on the balance sheet before sale.
- The standard formula is average inventory divided by COGS, multiplied by the number of days in the period.
- Inventory usually comes from the balance sheet, while COGS or cost of sales comes from the income statement.
- High or low DIO needs industry, trend, demand, and cash-flow evidence before it becomes useful.
- DIO connects directly to inventory turnover and forms one inventory leg of cash conversion analysis.
What Days Inventory Outstanding Means
Days inventory outstanding converts inventory efficiency into a time measure. Instead of asking how often inventory turns over, DIO asks how many days inventory typically remains on hand before being recognized through cost of goods sold.
The metric is most useful when compared with the same company’s history, close peers, and business model. A grocery retailer, a hardware seller, a luxury manufacturer, and an industrial equipment company can all have very different normal inventory cycles.
DIO is a metric, not a quality verdict. It can point toward faster inventory conversion, slower demand, intentional seasonal stocking, product-cycle buildup, or potential inventory-quality risk. The surrounding financial statement evidence decides which reading is more defensible.
Days Inventory Outstanding Formula
The standard DIO formula divides average inventory by cost of goods sold, then multiplies the result by the number of days in the period.
Formula: Days Inventory Outstanding = Average Inventory ÷ COGS × Number of Days
For an annual period, the number of days is commonly 365. For a quarter or shorter period, the period length should match the financial data being used.
| Formula input | What it means | Interpretation note |
|---|---|---|
| Average inventory | The average inventory balance during the period. | Usually calculated from beginning inventory and ending inventory. |
| COGS or cost of sales | The cost assigned to goods sold during the period. | Use the line item that matches the company’s reporting language. |
| Number of days | The length of the measurement period. | Use 365 for a full year or the relevant period length for shorter periods. |
DIO also has an inverse relationship with the inventory turnover ratio. When annual inventory turnover is already known, annual DIO can be approximated as 365 divided by inventory turnover.
Where To Find the Inputs
The DIO calculation uses information from two main financial statements. Inventory is a balance-sheet item, while COGS or cost of sales is an income-statement item.
| Input | Statement location | Cross-check |
|---|---|---|
| Inventory | Balance sheet | Compare beginning and ending inventory to avoid relying only on a single period-end balance. |
| COGS / cost of sales | Income statement | Use the cost line tied to goods sold, not total operating expenses. |
| Working-capital movement | Cash-flow statement or working-capital schedule | Check whether inventory changes support or weaken the cash-flow reading. |
Average inventory often gives a cleaner reading than ending inventory alone because a single reporting date can be affected by seasonality, supply-chain timing, or management decisions near period end.
Inventory accounting and averaging choices can change the ratio. A more useful comparison keeps the calculation method consistent across periods and checks whether inventory movement matches the company’s reported sales and cash-flow pattern.
Simple DIO Calculation Example
Example: A company reports average inventory of $10 million and COGS of $50 million for a 365-day period. DIO equals $10 million ÷ $50 million × 365, or 73 days.
A 73-day DIO means the company held inventory for about 73 days on average before that inventory moved through cost of goods sold. That number is only a starting point. It needs comparison with prior periods, similar companies, and the company’s normal product cycle.
If DIO rises while gross margin weakens or inventory write-downs increase, the inventory build deserves more scrutiny than the ratio alone provides.
How Investors Interpret High and Low DIO
High DIO often points to slower inventory movement, but it can also reflect planned inventory buildup before a seasonal sales period or a business model that naturally requires longer production cycles. Low DIO often points to faster inventory conversion, but it can also reflect understocking risk or lost sales if inventory is too lean.
| DIO pattern | Possible interpretation | What to check next |
|---|---|---|
| Rising DIO | Inventory is taking longer to move through sales. | Check demand, product mix, inventory write-downs, gross margin, and whether sales growth is slowing. |
| Falling DIO | Inventory is converting into sales more quickly. | Check whether the company is improving efficiency or running inventory too lean. |
| High DIO versus peers | The company may hold more inventory for its sales base. | Check industry norms, product complexity, lead times, and whether excess inventory is building. |
| Low DIO versus peers | The company may operate with faster inventory flow. | Check product availability, customer demand, supply constraints, and margin sustainability. |
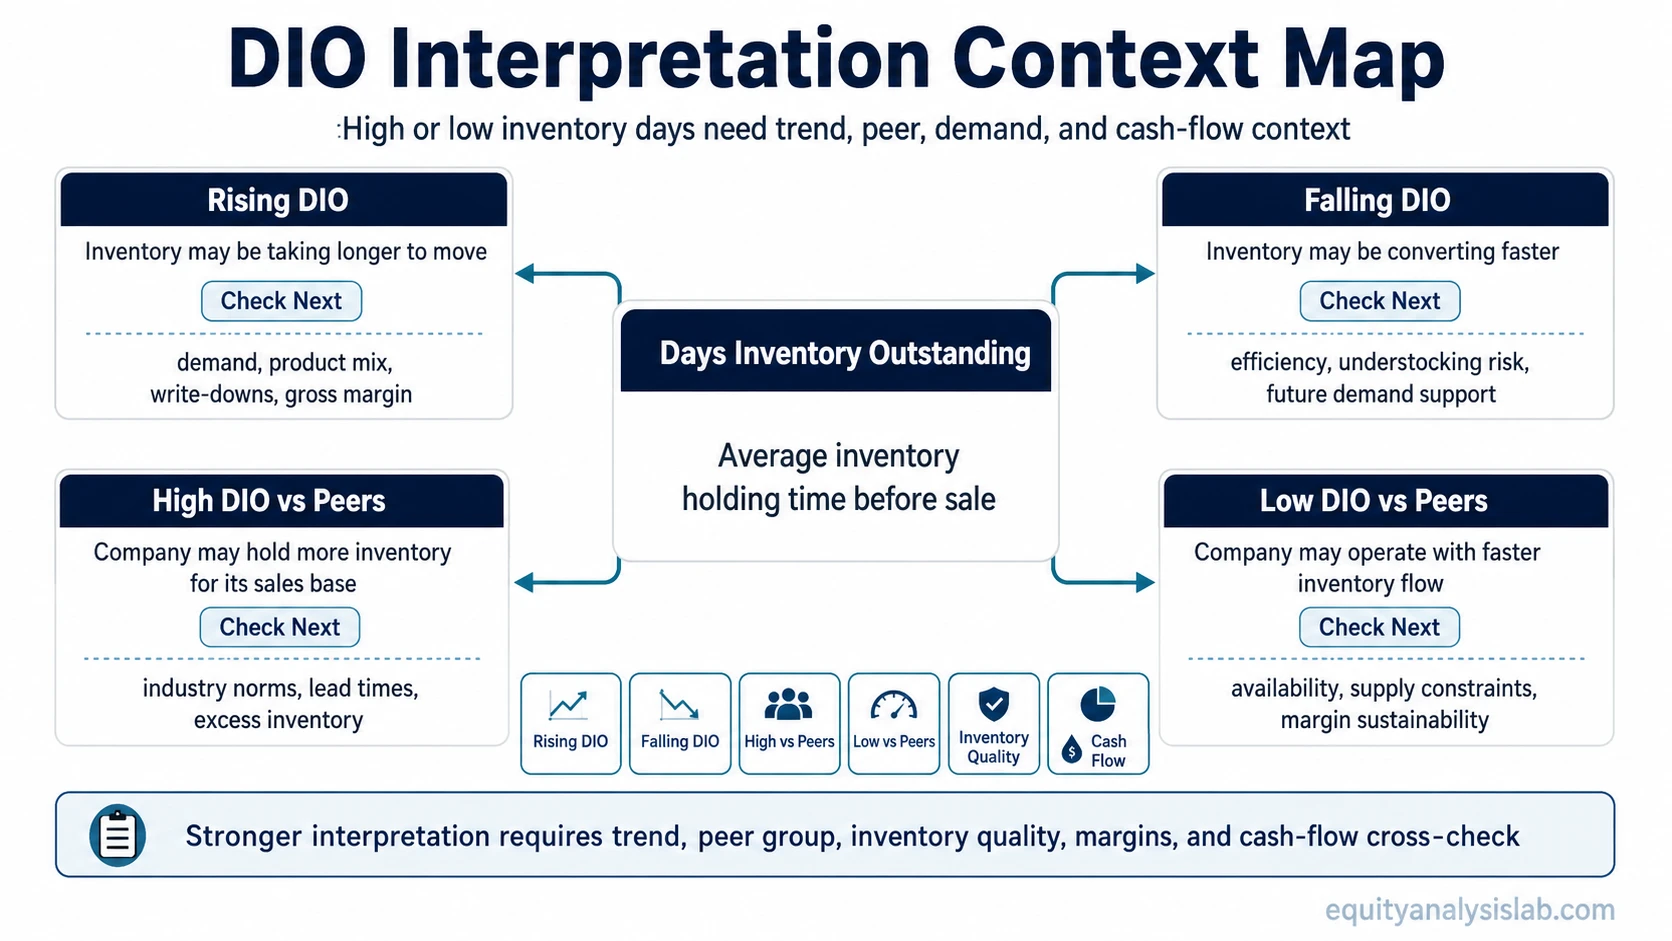
A low DIO reading should be checked against product availability and demand rather than treated as automatically superior. An efficient inventory cycle is more persuasive when it appears alongside stable margins, healthy revenue quality, and cash conversion that does not rely on short-term working-capital strain.
DIO, Inventory Turnover, and Cash Conversion
DIO and inventory turnover describe the same inventory cycle from different angles. Inventory turnover measures how many times inventory is sold and replaced during a period, while DIO translates that activity into an average number of days.
DIO is also one part of cash conversion analysis. Inventory days describe how long cash is tied up in inventory before sale. Days sales outstanding then measures customer collection timing after sales are made.
The supplier-payment side is separate. Days payable outstanding measures how long a company takes to pay suppliers, so it should not be confused with how long inventory remains on hand.
| Metric | Timing question | Boundary |
|---|---|---|
| DIO | How long does inventory remain on hand before sale? | Inventory holding time. |
| DSO | How long does the company take to collect from customers? | Receivables collection time. |
| DPO | How long does the company take to pay suppliers? | Payables timing. |
Common Mistake: Treating DIO as a Standalone Verdict
Limitation: DIO can look efficient while cash-flow evidence remains weaker if inventory movement does not translate into cleaner working-capital conversion. The ratio should be read with margins, sales trends, inventory quality, and the company’s normal operating cycle.
A falling DIO may reflect better inventory discipline, but it may also reflect inventory shortages, supply constraints, or a temporary drawdown that cannot continue. A rising DIO may reflect weakening demand, but it may also reflect deliberate buildup before a seasonal period or a long-cycle production model.
Accounting choices can also affect interpretation. Inventory valuation methods, write-down timing, and the use of average versus ending inventory can change the apparent ratio even when the underlying business trend is less clear.
The strongest DIO reading usually comes from consistency: the same calculation method across periods, peer comparison within a similar business model, and a cash-flow cross-check that supports the operating-efficiency reading.
Related Operating Efficiency Metrics
DIO focuses on inventory holding time, but working-capital analysis also needs customer collection timing, supplier-payment timing, and inventory movement frequency.
| Related metric | What it adds | How it differs from DIO |
|---|---|---|
| Inventory turnover ratio | Shows how many times inventory turns during a period. | DIO converts inventory turnover into days. |
| Days sales outstanding | Shows customer collection timing. | DSO starts after a sale creates receivables. |
| Days payable outstanding | Shows supplier-payment timing. | DPO relates to payables, not inventory holding time. |
FAQ
What is a good days inventory outstanding number?
A good DIO number depends on the industry, product cycle, business model, and company history. The same number can be efficient for one type of company and slow for another.
Is lower DIO always better?
No. Lower DIO can mean faster inventory conversion, but it can also point to understocking, supply constraints, or inventory levels that may not support future demand.
Is DIO the same as inventory turnover?
No. Inventory turnover measures how many times inventory turns during a period, while DIO converts inventory movement into the average number of days inventory remains on hand.
Where do the DIO inputs come from?
Inventory usually comes from the balance sheet, while COGS or cost of sales comes from the income statement. Average inventory is commonly calculated from beginning and ending inventory.