Days payable outstanding is an operating-efficiency and working-capital timing metric that estimates how many days a company takes to pay suppliers after purchases are recorded.
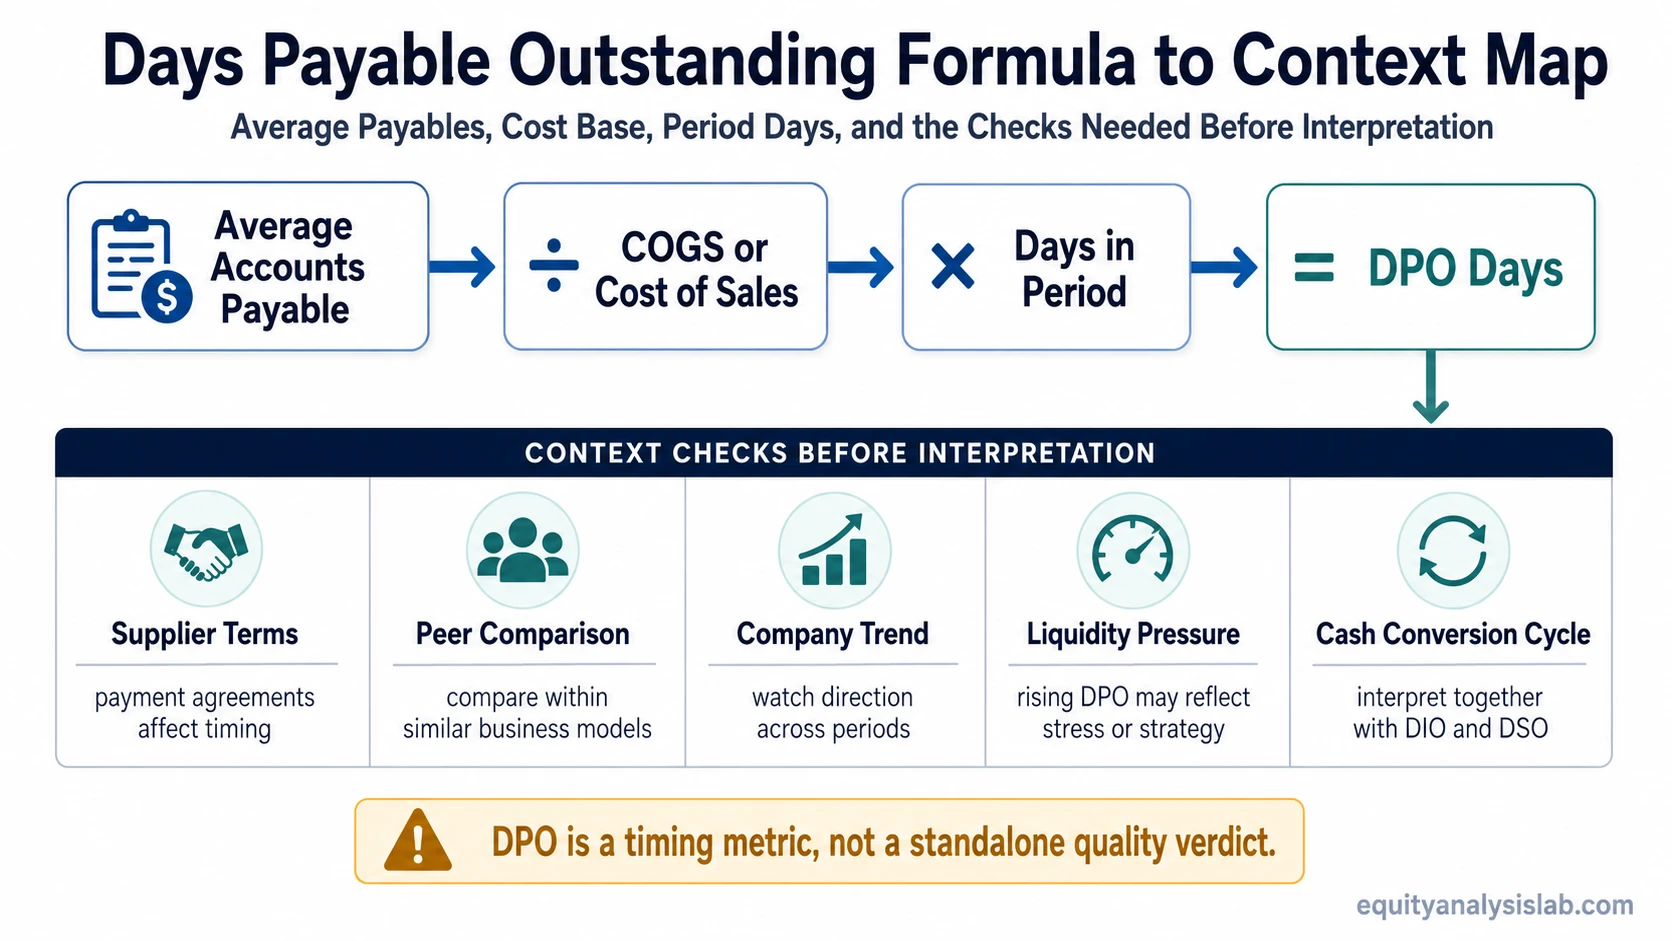
The DPO formula uses average accounts payable, cost of goods sold or cost of sales, and the number of days in the period. The result becomes useful only when it is read against supplier terms, peer behavior, company trend, and the broader cash conversion cycle.
Key Points
- Days payable outstanding measures supplier-payment timing, not overall company quality.
- The standard formula uses average accounts payable divided by COGS or cost of sales, multiplied by days in the period.
- A rising DPO can reflect stronger payment terms, but it can also reflect liquidity pressure or delayed supplier payments.
- DPO should be compared with peers, company history, and related operating-efficiency metrics before drawing a conclusion.
What Is Days Payable Outstanding?
Days payable outstanding, or DPO, is the average number of days a company takes to pay its suppliers for goods and services already purchased on credit.
DPO belongs to the payables side of working capital. It focuses on how long cash stays inside the business before supplier obligations are paid. That makes it useful for reading supplier-payment timing, but it does not prove that a company has strong cash flow, good liquidity, favorable supplier relationships, or attractive valuation.
The same DPO value can mean different things in different industries. A retailer, manufacturer, software company, and distributor may operate with different supplier terms, inventory cycles, gross margins, and purchasing patterns. DPO is therefore a diagnostic ratio, not a standalone verdict.
Days Payable Outstanding Formula
The common days payable outstanding formula is:
DPO = Average Accounts Payable / Cost of Goods Sold × Number of Days in the Period
Some companies use cost of sales instead of cost of goods sold when that line better matches how purchases are reported. The important point is consistency: the denominator should match the operating cost base that created the supplier payable.
| Formula input | What it represents | Interpretation caveat |
|---|---|---|
| Average accounts payable | The average supplier payable balance across the period. | Average AP can reduce single-date distortion when payable balances fluctuate around the reporting date. |
| COGS or cost of sales | The cost base connected to goods or services purchased from suppliers. | The denominator should be selected consistently across periods and peer comparisons. |
| Number of days in period | The calendar length used to express the result in days. | Annual calculations often use 365 days; quarterly calculations may use roughly 90 or 91 days depending on the period. |
Using ending accounts payable can be acceptable in a quick estimate, but it is less reliable when supplier payments, purchasing, or inventory receipts are uneven around the reporting date. Average accounts payable is usually the better choice when the goal is period-to-period analytical consistency.
How to Calculate DPO
Assume a company reports average accounts payable of $18 million, annual cost of goods sold of $120 million, and uses 365 days for the period.
Step 1: Divide average accounts payable by cost of goods sold.
$18 million / $120 million = 0.15
Step 2: Multiply by the number of days in the period.
0.15 × 365 = 54.75 days
Result: The company’s DPO is about 55 days.
This means the company takes about 55 days, on average, to pay suppliers. The next step is to compare the result with normal supplier terms, prior company periods, and similar companies.
How to Interpret High and Low DPO
DPO interpretation depends on why the number is high, low, rising, or falling. The ratio should be read as a payment-timing signal first and a quality signal only after supporting evidence exists.
| DPO pattern | Possible reading | What to check before interpreting |
|---|---|---|
| High DPO | The company is taking longer to pay suppliers. | Check whether this reflects negotiated terms, supplier leverage, seasonal timing, or delayed payments caused by cash stress. |
| Low DPO | The company is paying suppliers faster. | Check whether this reflects strong payment discipline, weaker credit terms, discounts for early payment, or industry norms. |
| Rising DPO | Cash may be staying in the business longer. | Check whether payables are growing faster than purchases and whether supplier relationships remain healthy. |
| Falling DPO | The company may be paying suppliers sooner. | Check whether the decline is caused by better liquidity, changing purchase terms, supplier pressure, or a shift in business mix. |
A high DPO can be favorable when it reflects durable supplier terms and disciplined working-capital management. It can be unfavorable when it reflects payment delays, liquidity strain, or deteriorating supplier trust. A low DPO can be unfavorable if the company lacks negotiating power, but it can also be normal for a business that pays quickly to secure supply, discounts, or reliability.
Why DPO Needs Peer and Trend Context
DPO is most useful when compared against companies with similar operating models. Supplier terms, inventory cycles, purchase frequency, credit availability, and industry structure can all change what a normal DPO range looks like.
DPO context check:
- Supplier terms: Are longer payment periods negotiated and stable, or are payments being stretched?
- Liquidity condition: Is DPO rising while cash, operating cash flow, or credit access is weakening?
- Business model: Does the company normally rely on inventory purchases, outsourced production, or recurring supplier invoices?
- Accounting base: Is the calculation using average AP and a consistent COGS or cost-of-sales denominator?
- Company trend: Is the current DPO consistent with the company’s own history, or did it move sharply in one period?
- Cycle relationship: Does DPO offset inventory and receivables timing, or is the broader working-capital cycle still deteriorating?
One-period changes deserve caution. A quarter-end payable balance can rise because of ordinary purchasing timing, a seasonal inventory build, slower supplier payments, or a shift in vendor mix. The ratio becomes more reliable when the same calculation is tracked across several periods.
DPO vs Related Operating Efficiency Metrics
DPO should not be confused with nearby operating-efficiency ratios. It focuses on payables days, while related ratios measure different parts of the working-capital cycle.
DPO: supplier-payment timing.
DIO: inventory holding time before goods are sold.
DSO: customer collection timing after sales are recorded.
Cash conversion cycle: the combined operating cycle view that adds DIO and DSO, then offsets them with DPO.
| Metric | What it measures | How it differs from DPO |
|---|---|---|
| accounts payable turnover ratio | How often payables turn over during a period. | AP turnover expresses frequency, while DPO converts payables timing into days. |
| days inventory outstanding metric | How long inventory stays before being sold. | DIO focuses on inventory timing, while DPO focuses on supplier-payment timing. |
| customer collection timing | How long the company takes to collect cash from customers. | DSO tracks receivables collection, while DPO tracks payments to suppliers. |
| Cash conversion cycle | How inventory, receivables, and payables timing combine. | DPO reduces the cycle when it offsets DIO and DSO, but it does not explain the full cycle by itself. |
Reading DPO beside inventory days and collection timing helps prevent a one-sided conclusion. A company may look efficient on supplier payments while still tying up cash in inventory or receivables.
Common Mistakes When Reading DPO
- Treating higher DPO as automatically good: Longer payment timing can preserve cash, but it can also signal supplier strain or delayed payments.
- Ignoring supplier relationships: A company can damage supply reliability if it stretches payments beyond normal commercial terms.
- Mixing calculation methods: Comparing average AP in one period with ending AP in another can distort the trend.
- Comparing unlike industries: Supplier terms differ across sectors, so cross-industry DPO comparisons can mislead.
- Reading one period in isolation: A single reporting date can reflect timing noise rather than a durable change in payment behavior.
The most important mistake is false comfort. A rising DPO can make working capital look better in the short term, but the quality of that improvement depends on whether payables are rising faster than purchases, whether supplier disputes are emerging, whether operating cash flow supports the business, and whether other parts of the working-capital cycle are stable.
FAQ
What does days payable outstanding measure?
Days payable outstanding measures the average number of days a company takes to pay suppliers after purchases are recorded. It is a payment-timing ratio, not a complete measure of company quality or liquidity strength.
What is the DPO formula?
The common DPO formula is average accounts payable divided by cost of goods sold, multiplied by the number of days in the period. Some companies use cost of sales when that line better matches the supplier cost base.
Is a high DPO good?
A high DPO can be useful when it reflects durable supplier terms and disciplined working-capital management. It can be a warning sign when it reflects delayed payments, liquidity pressure, or strained supplier relationships.
Why compare DPO with DIO and DSO?
DPO only covers supplier-payment timing. DIO covers inventory timing and DSO covers customer collection timing, so the three ratios together give a broader view of the working-capital cycle.