Days sales outstanding measures how many days a company takes, on average, to convert accounts receivable into cash after sales are recorded.
Definition: Days sales outstanding, or DSO, is a receivables-to-sales timing measure. It compares average accounts receivable with sales over a matching period and converts that relationship into days.
For investors, DSO connects revenue recognition with cash collection. A rising or falling DSO can change the quality of a revenue trend, but the number is only an approximation. Credit terms, customer mix, seasonality, and sales growth can all change the interpretation.
Key Points
- DSO estimates how long sales remain tied up in accounts receivable before cash is collected.
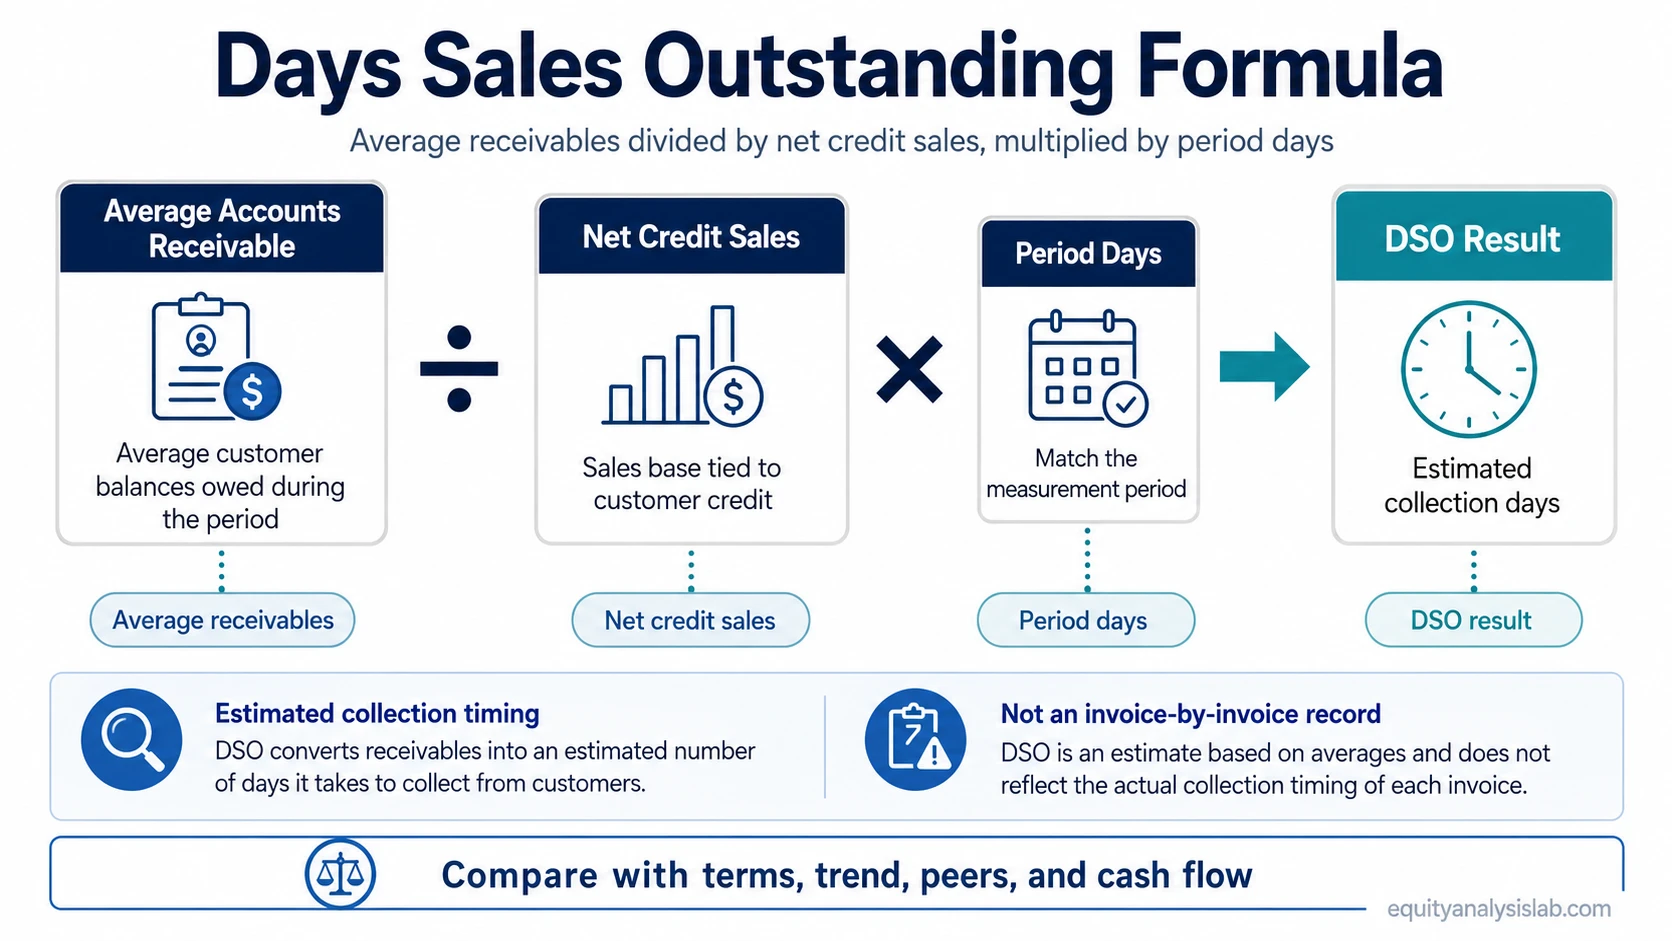
- The basic formula is average accounts receivable divided by net credit sales, multiplied by the number of days in the period.
- A higher DSO can indicate slower collection or looser credit terms, but it is not automatically negative.
- A lower DSO can indicate faster collection or stricter terms, but it is not automatically superior.
- DSO is most useful when compared with credit terms, peers, prior periods, sales mix, and cash-flow conversion.
What Days Sales Outstanding Measures
DSO measures the relationship between receivables and sales in days. If a company reports sales before collecting cash, accounts receivable carry the unpaid portion. DSO translates that unpaid receivable balance into an estimated collection period.
The metric is especially useful when revenue is growing quickly, when receivables are expanding faster than sales, or when customer payment behavior may be changing. It does not prove revenue quality on its own, but it can highlight where cash collection deserves closer attention.
Investor note: DSO sharpens receivables analysis, but it should not replace cash-flow analysis, revenue-quality review, or business-model context.
Days Sales Outstanding Formula
The standard days sales outstanding formula is:
DSO = Average Accounts Receivable / Net Credit Sales × Number of Days
The numerator captures the receivables balance tied to customer payments. The denominator captures the sales base that created those receivables. The period-day multiplier converts the ratio into a days-based measure.
| Formula component | What it represents | Interpretation issue |
|---|---|---|
| Average accounts receivable | The average amount customers owed during the period | Using only ending receivables can distort DSO when receivables move sharply during the period |
| Net credit sales | The sales base tied to customer credit rather than immediate cash collection | Some companies disclose revenue more clearly than net credit sales, so the denominator may be an approximation |
| Number of days | The measurement period, such as 365 days for a year or about 90 days for a quarter | The days used should match the period used for sales and receivables |
| DSO result | The estimated number of days sales remain in receivables before cash collection | The result needs trend, peer, credit-term, and cash-flow context |
How to Calculate Days Sales Outstanding
A simple hypothetical example can show the mechanics. If a company has average accounts receivable of $2 million, net credit sales of $12 million, and a 365-day period, the calculation is:
Example calculation: $2 million / $12 million × 365 = 60.8 days.
That result means the company has roughly 61 days of sales tied up in receivables based on the selected inputs. The number is not an invoice-by-invoice collection record. It is a period-level approximation built from financial-statement balances.
The same 61-day DSO can have different meanings. If normal customer terms are 60 days, the result may be broadly consistent with the business model. If normal terms are 30 days, the same result may suggest slower collection, looser credit discipline, billing delays, or customers taking longer to pay.
Calculation caution: When total revenue is used as a proxy for net credit sales, DSO can be less precise if cash sales and credit sales follow different payment patterns.
What High or Low DSO Can Mean
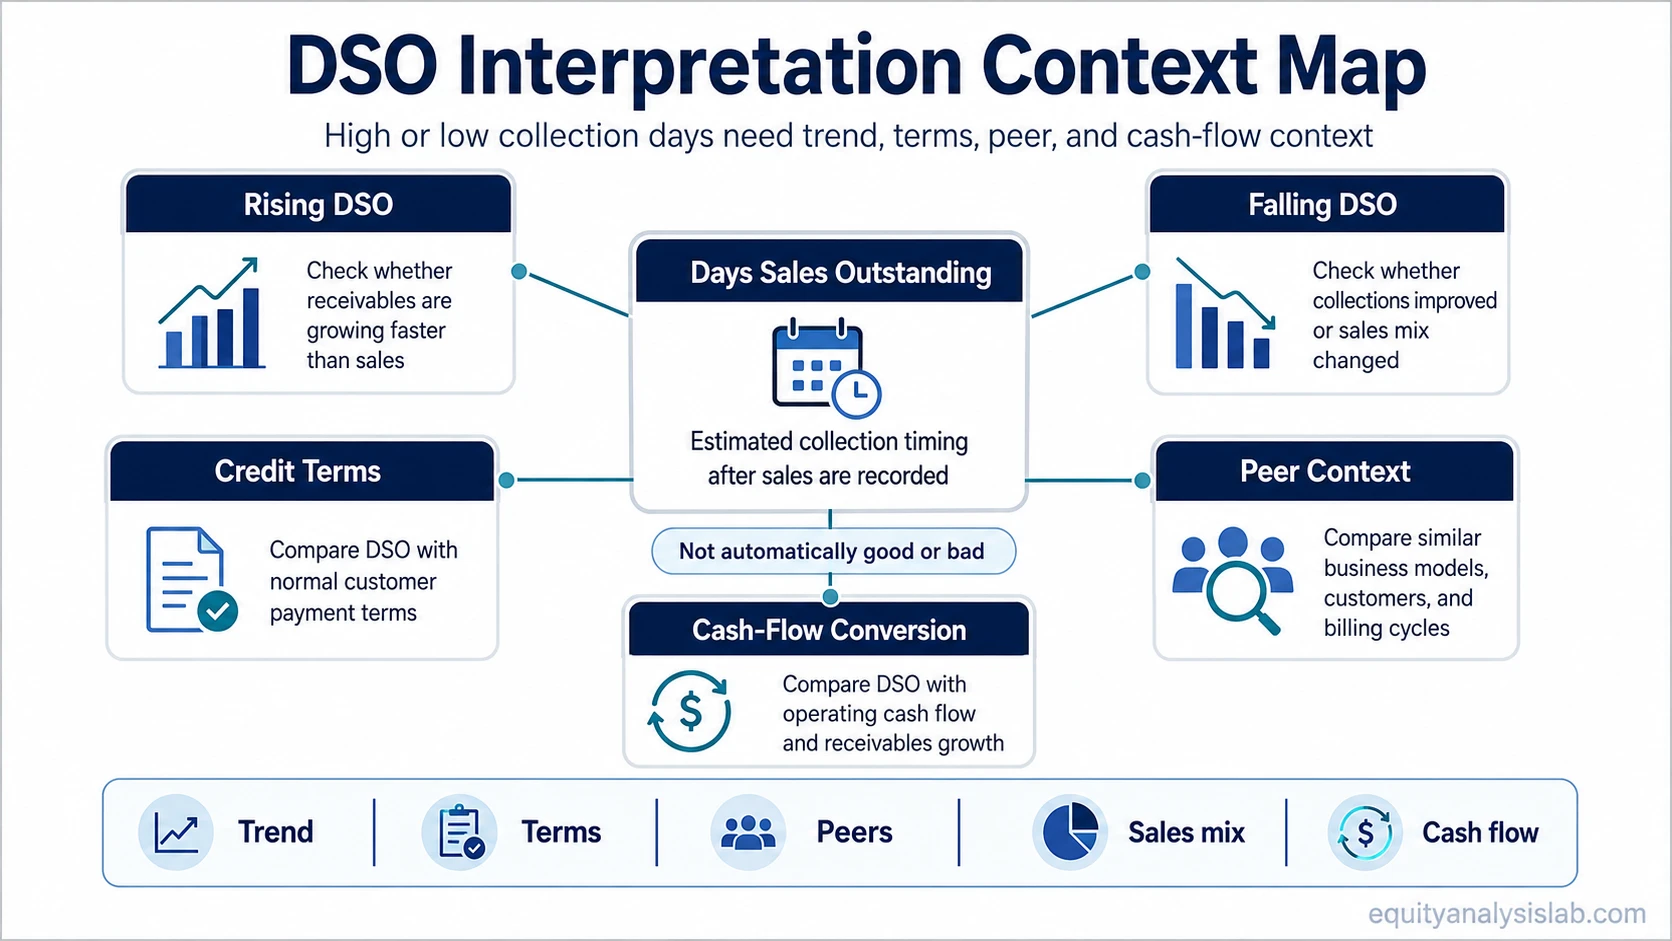
A higher DSO usually means receivables are taking longer to convert into cash. That deserves a receivables-quality check when the increase is faster than sales growth or appears alongside weaker operating cash flow.
A lower DSO usually means receivables are converting into cash more quickly. The reading is cleaner when it comes from stable payment behavior rather than a temporary shift toward cash sales, shorter terms, or a different customer mix.
Neither direction is automatically good or bad. A low DSO can look efficient, but it may also reflect restrictive credit terms that limit sales growth in some business models. A high DSO can look weak, but it may be normal in industries with longer billing cycles or large enterprise customers.
| DSO pattern | Clean reading | Weak reading | Misleading reading risk |
|---|---|---|---|
| DSO rises while sales grow | Growth may be tied to longer customer payment timing | Receivables may be growing faster than cash collection | Strong revenue growth can look better than cash conversion if receivables quality is not checked |
| DSO falls while sales remain stable | Collections may be improving | Stricter terms may be reducing customer flexibility | A lower number can look efficient even if it comes from sales mix changes rather than better collection |
| DSO stays flat across periods | Collection timing may be stable | Stable averages may hide customer concentration or aging issues | Flat DSO can mask changes inside the receivables balance |
| DSO is far above peers | The business may operate with longer normal terms | Collections, credit quality, or revenue timing may need review | Peer comparison can mislead if sales mix, geography, and customer type differ |
When DSO Can Mislead Investors
DSO can mislead when the number is treated as a standalone verdict. The same result can come from different combinations of credit policy, growth timing, seasonality, customer type, and accounting presentation.
Common mistake: Calling a lower DSO automatically better ignores whether the company is sacrificing customer flexibility, changing its sales mix, or benefiting from temporary timing effects.
| Distortion source | How it affects DSO | What to compare |
|---|---|---|
| Seasonality | Receivables can rise or fall around peak sales periods | Same quarter in prior years, not only the previous quarter |
| Sales mix | Cash sales and credit sales can produce different receivable patterns | Revenue composition and customer-payment model |
| Credit terms | Longer contractual terms can raise DSO without necessarily signaling collection failure | Normal payment terms, industry norms, and disclosed receivables aging |
| Customer concentration | A few large customers can dominate receivables timing | Major customer exposure and receivables concentration |
| Average vs ending receivables | Ending balances can overstate or understate the normal period pattern | Average receivables and multi-period trend |
| Revenue growth or decline | Fast sales changes can distort receivables-to-sales comparisons | Sales growth, cash from operations, and receivables growth together |
A stronger DSO reading compares the DSO trend with sales growth, receivables growth, cash from operations, customer terms, and peer context.
DSO Compared With Nearby Operating-Efficiency Metrics
DSO belongs inside working-capital analysis, but it measures only the customer-collection side of the cycle. Nearby metrics answer different timing questions.
| Metric | Main question | How it differs from DSO |
|---|---|---|
| Days sales outstanding | How long sales remain in receivables before cash collection | Focuses on customer payment timing after sales are recorded |
| Days inventory outstanding | How long inventory is held before sale | Focuses on inventory timing before revenue is recognized |
| Days payable | How long the company takes to pay suppliers | Focuses on supplier-payment timing rather than customer collection timing |
| accounts payable turnover ratio | How frequently supplier payables are turned over | Uses a turnover-rate lens instead of a customer-receivable days lens |
DSO works best as the customer-collection measure inside working-capital analysis. Inventory days, supplier-payment days, and payable turnover add different timing views, but they should not be collapsed into a single cash-flow score.
FAQ
What does days sales outstanding mean?
Days sales outstanding means the estimated number of days a company takes to collect cash from sales recorded as accounts receivable.
Is a lower DSO always better?
No. A lower DSO can indicate faster collection, but it can also reflect stricter credit terms, sales mix changes, or temporary timing effects.
Why can two companies have different DSO levels?
Different DSO levels can come from industry norms, credit terms, customer type, seasonality, revenue mix, and collection processes.
Can DSO use revenue instead of net credit sales?
Revenue is sometimes used as a proxy when net credit sales are not disclosed, but that can make the result less precise if cash sales and credit sales differ materially.