Drawdown in investing is the peak-to-trough decline in a portfolio, fund, or asset before recovery is evaluated.
The percentage alone is not enough. A 15% drawdown can mean different things depending on what caused it, how concentrated the exposure was, how long recovery took, and whether the investor’s time horizon and liquidity needs can absorb the decline.
Definition: Drawdown measures how far an investment or portfolio falls from a previous high to a later low before a recovery point is evaluated. It is usually expressed as a percentage of the peak value.
Key Points
- Drawdown measures a decline from peak to trough, not simply a daily price move.
- It is usually shown as a percentage so different portfolio sizes can be compared more clearly.
- Depth, duration, and recovery path all change the interpretation.
- Portfolio drawdown analysis depends on weights, overlap, concentration, liquidity needs, time horizon, and risk capacity.
- Drawdown is backward-looking and does not predict future returns.
What Drawdown Means in Investing
A drawdown begins after a portfolio, fund, or asset reaches a peak value. It continues until the value reaches a trough. The drawdown can then be measured by comparing the peak with the trough.
In portfolio analysis, drawdown connects loss magnitude with investor experience. A decline that looks moderate on paper can still matter if it lasts a long time, affects money needed soon, or comes from a risk exposure that was larger than expected.
Drawdown also helps separate price movement from portfolio structure. A portfolio can fall because nearly everything reprices at once, or because a small number of holdings dominate the result. Those two cases can produce the same percentage decline but require different interpretation.
How Drawdown Is Calculated
The basic drawdown formula compares a peak value with a later trough value:
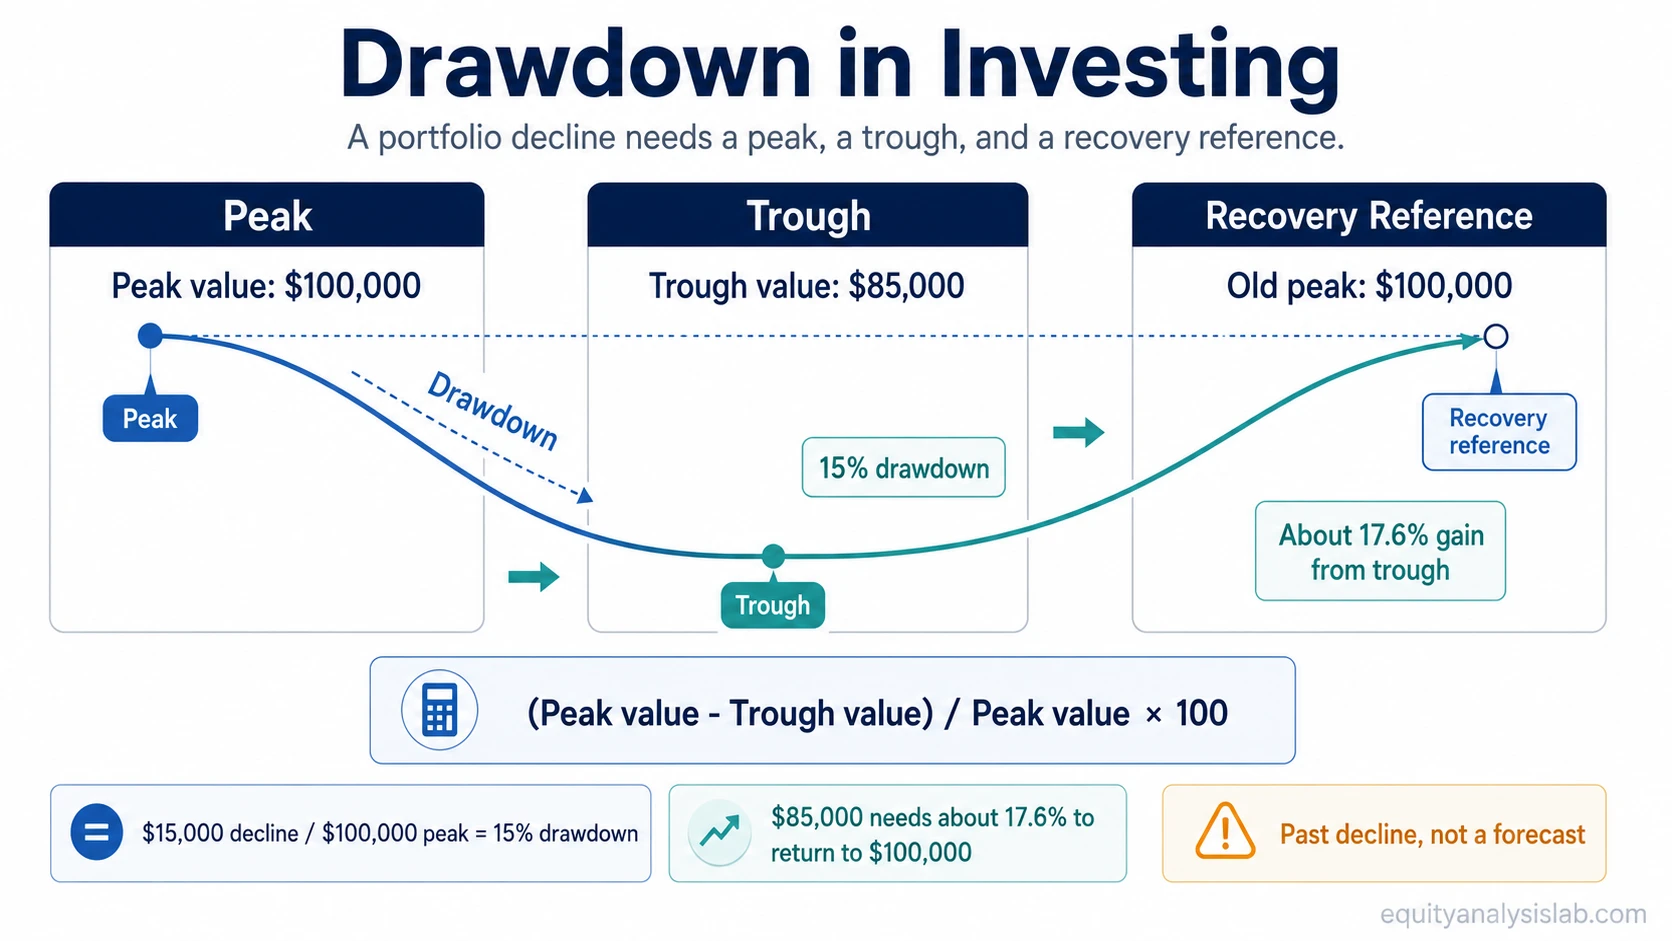
Formula: (Peak value – Trough value) / Peak value × 100
For example, if a portfolio rises to $100,000 and later falls to $85,000 before recovering, the drawdown is 15%.
A 15% drawdown does not require only a 15% gain from the trough to return to the old peak. After a fall from $100,000 to $85,000, the portfolio needs about a 17.6% gain from $85,000 to reach $100,000 again.
| Input | Value | Role in the calculation |
|---|---|---|
| Peak value | $100,000 | The highest value before the decline being measured |
| Trough value | $85,000 | The lowest value reached before recovery is evaluated |
| Dollar decline | $15,000 | The difference between peak and trough |
| Drawdown percentage | 15% | The decline as a share of the peak value |
| Gain needed from trough | About 17.6% | The gain from $85,000 required to return to $100,000 |
The percentage format matters because a $15,000 decline means something different in a $100,000 portfolio than in a $1,000,000 portfolio. The dollar amount describes the size of the decline. The percentage describes its scale relative to the starting peak.
What Drawdown Shows in a Portfolio
Drawdown becomes more useful when the percentage is connected to the source of the decline. Portfolio structure, exposure overlap, and investor constraints can change the meaning of the same measured drop.
| Input to check | What it asks | Why it changes the interpretation |
|---|---|---|
| Depth | How large was the peak-to-trough decline? | A deeper decline may require a larger recovery before the portfolio reaches the old peak again. |
| Duration | How long did the decline last? | A shorter drop and a long unresolved decline can feel very different even at the same percentage. |
| Recovery path | Was recovery smooth, partial, or still incomplete? | The path after the trough affects whether the drawdown was temporary pressure or a more persistent portfolio issue. |
| Position weights | Which holdings drove most of the decline? | A few large weights can dominate the portfolio result even when the holdings list looks diversified. |
| Concentration source | Did the decline come from one holding, one sector, one factor, or one theme? | Portfolio concentration can make a drawdown depend heavily on fewer decision drivers. |
| Exposure overlap | Do different holdings depend on similar revenue, rate, commodity, currency, or valuation drivers? | Holdings can look separate while still reacting to the same underlying pressure. |
| Asset allocation | How much of the portfolio sits in stocks, bonds, cash, funds, sectors, or other exposure groups? | Asset allocation shapes how broad market moves flow into the total portfolio. |
| Rebalancing drift | Did the portfolio move away from its intended mix before the decline? | A portfolio can carry more risk than intended if winning exposures grow too large before a reversal. |
| Liquidity need | Will the investor need to sell during or soon after the decline? | A temporary drawdown becomes more serious when it collides with near-term cash needs. |
| Time horizon | How much time does the investor have before the money is needed? | The same decline may be easier or harder to absorb depending on the investment horizon. |
| Risk capacity | Can the investor financially withstand the decline without changing the plan under pressure? | Risk capacity is about the ability to bear loss, not only the emotional willingness to accept volatility. |
Drawdown vs Loss vs Maximum Drawdown
Drawdown is not always the same as a realized loss. A drawdown can describe an unrealized decline from a previous peak. A realized loss happens when an investment is sold below its cost or below a relevant reference value.
Maximum drawdown is narrower. It measures the largest peak-to-trough decline over a defined measurement period. A portfolio may have many drawdowns, but maximum drawdown identifies the largest one within the chosen window.
Volatility describes how much values fluctuate over time, while drawdown focuses on the distance from a prior peak to a later trough.
| Concept | What it measures | Important boundary |
|---|---|---|
| Drawdown | A decline from a peak to a later trough | Can be measured before a position or portfolio is sold |
| Realized loss | A loss locked in through sale or disposal | Depends on transaction and reference value |
| Maximum drawdown | The largest drawdown over a defined period | Depends on the chosen start and end dates |
| Volatility | Variation in value over time | Does not necessarily measure the distance from a prior peak |
Same Drawdown, Different Portfolio Meaning
Example: Two hypothetical portfolios both fall 15% from peak to trough.
Portfolio A holds many securities, but a few related positions carry most of the weight. The decline comes mainly from those connected exposures. The 15% drawdown is therefore less about the holdings count and more about dependence on a concentrated source of risk.
Portfolio B also falls 15%, but the decline is spread across many holdings during broad market repricing. No single position dominates the result. The analysis shifts toward allocation mix, market-wide exposure, recovery path, and whether the investor’s time horizon can absorb the decline.
The same percentage does not prove that either portfolio is automatically stronger. It shows why drawdown needs a second layer of analysis: cause, weight, overlap, recovery, and investor constraints.
What Drawdown Does Not Tell You
Limitation: Drawdown is backward-looking. It describes what happened between a past peak and trough, not what must happen next.
A drawdown does not predict future returns, guarantee recovery, or prove that a portfolio fits every investor constraint better or worse. It also does not identify the cause by itself. The cause has to be checked through holdings, weights, exposure overlap, allocation mix, liquidity needs, and the investor’s time horizon.
A smaller drawdown is not automatically better in every context. It may reflect lower exposure, a shorter measurement window, a different asset mix, or a temporary period with fewer visible risks. A larger drawdown may be unacceptable for one investor and manageable for another, depending on risk capacity and the timing of cash needs.
Related Portfolio Concepts
Drawdown connects to several portfolio concepts, but each one answers a different question.
| Concept | Question it answers | How it connects to drawdown |
|---|---|---|
| Maximum drawdown | What was the largest peak-to-trough decline in the chosen period? | It narrows drawdown analysis to the worst measured decline inside a defined window. |
| Asset allocation | What broad exposures make up the portfolio? | The portfolio mix affects which market pressures can drive the decline. |
| Concentration | How dependent is the portfolio on a few holdings or shared drivers? | A drawdown can reveal dependence that a holdings list alone may hide. |
| Holdings count | How many securities are owned? | How many stocks should you own is a different question from whether those holdings reduce shared exposure. |
FAQ
Is drawdown the same as a loss?
No. Drawdown can describe an unrealized decline from a previous peak, while a realized loss depends on selling or disposing of the investment below a relevant reference value.
Does drawdown predict future returns?
No. Drawdown is backward-looking. It can describe past decline and recovery pressure, but it does not predict future returns.