A DCF valuation example shows how forecast free cash flow, a discount rate, terminal value, net debt or cash, and share count can be connected into a valuation range. The output is an assumption-driven estimate, not proof that one number is certain.
Direct answer: In a DCF valuation example, future cash flows are estimated, discounted back to present value, adjusted for debt and cash, and then divided by share count to create a per-share valuation range. The range changes when the assumptions change.
- A DCF example is driven by assumptions, not certainty.
- Free cash flow, the discount rate, and terminal value usually drive most of the output.
- A company valuation has to bridge enterprise value to equity value before any per-share estimate is useful.
- Sensitivity is part of the DCF result, not an optional extra.
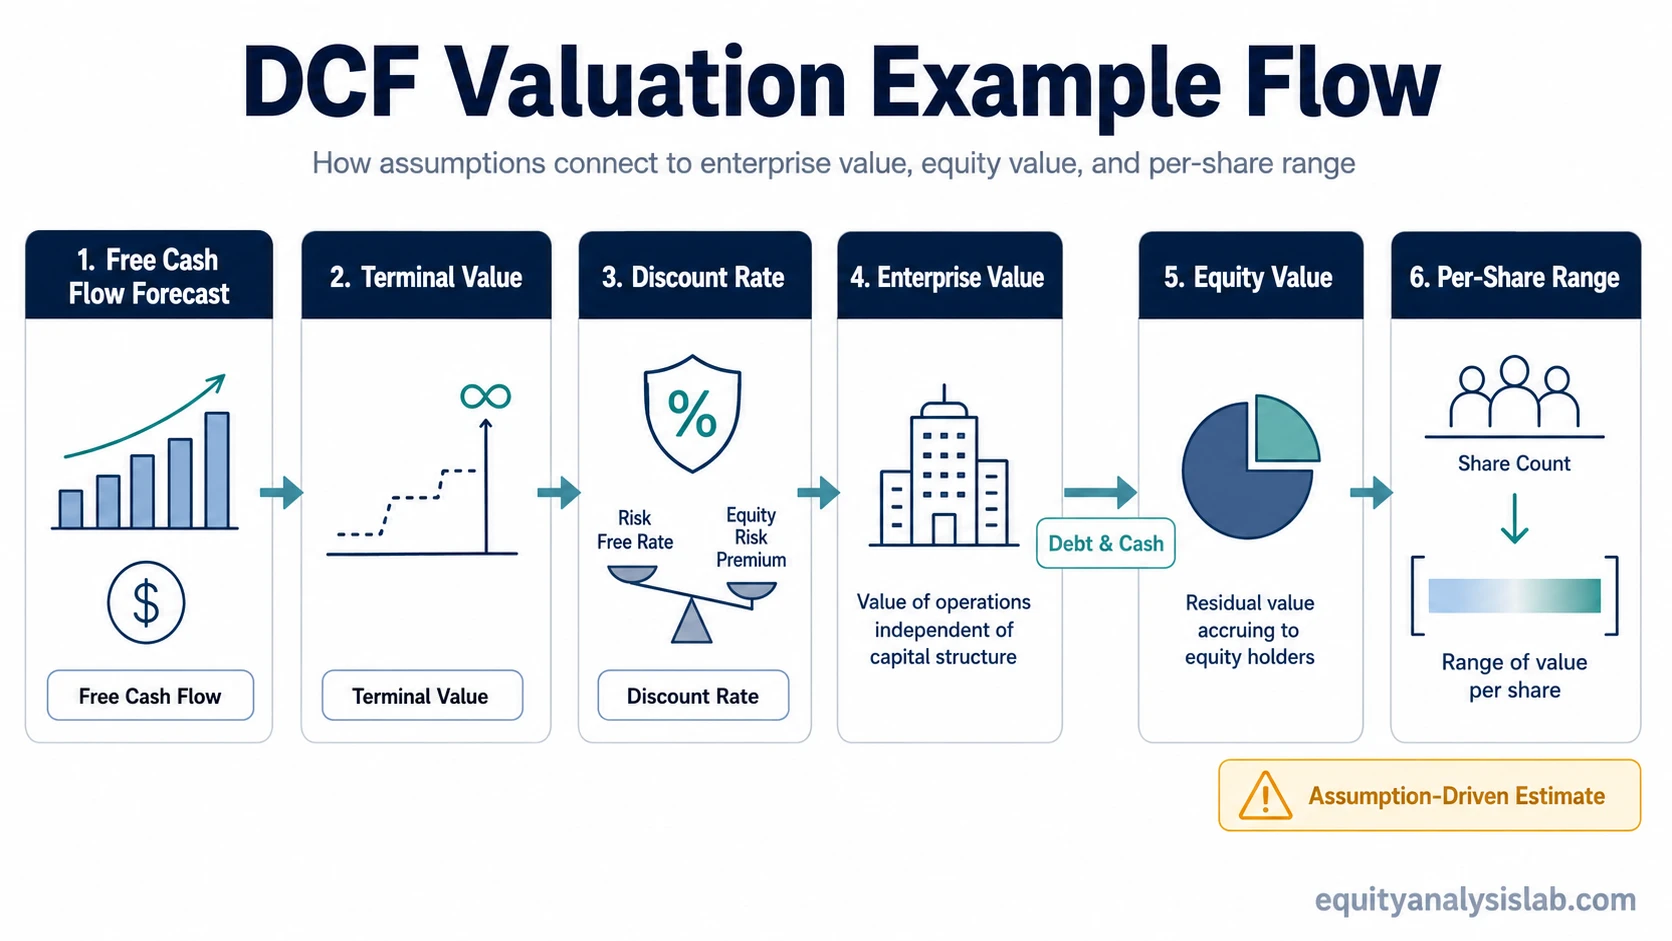
What a DCF valuation example shows
The example connects operating assumptions to estimated business value. The basic logic is that a company may be worth the present value of the cash it can generate for its capital providers, adjusted for balance-sheet items and share count.
The discounted cash flow method starts with expected future cash flows. Those cash flows are then discounted because a dollar expected in the future is not worth the same as a dollar available today. The higher the required return or risk adjustment, the lower the present value of the same future cash flow.
| DCF step | What it does | Why it affects the result |
|---|---|---|
| Forecast cash flow | Estimates the cash the business may generate over the explicit forecast period. | Higher or lower cash-flow assumptions directly change the value base. |
| Estimate terminal value | Approximates value beyond the explicit forecast period. | Small changes can have a large effect because terminal value often represents a major portion of DCF value. |
| Discount future value | Converts future cash flows into present value. | A higher discount rate reduces present value; a lower discount rate increases it. |
| Bridge to equity value | Adjusts enterprise value for net debt or net cash. | The business value and the common equity value are not always the same number. |
| Divide by shares | Turns total equity value into a per-share estimate. | Share count changes can materially change the per-share result. |
The assumptions behind the example
A DCF valuation is only as useful as the assumptions behind it. The model can look precise while the conclusion remains fragile if the cash-flow forecast, discount rate, terminal value, or share count is weakly supported.
| Assumption | Role in the DCF | What to watch |
|---|---|---|
| Free cash flow | Provides the cash-flow base used in the forecast. | Cash flow should be judged for durability, not only for size in one year. |
| Growth | Controls how cash flow changes during the forecast period. | Growth that requires unrealistic margin expansion or capital-light assumptions can distort the result. |
| Discount rate | Reflects required return, risk, and the time value of money. | A small change can materially move present value. |
| Terminal value | Captures value beyond the explicit forecast window. | Terminal assumptions should not be used to force the model toward a preferred answer. |
| Debt and cash | Move from enterprise value to equity value. | Net debt reduces equity value; net cash can increase it. |
| Share count | Converts equity value into a per-share estimate. | Dilution can reduce per-share value even when total business value rises. |
Simple present value logic: future cash flow is discounted by a required return for each year it sits in the future. In simplified form, present value equals future cash flow divided by a discount factor. The farther out the cash flow is, the more sensitive it becomes to the discount rate.
A simple hypothetical DCF valuation example
Hypothetical example: Company A is used only as a rounded illustration. The numbers below are not based on a real company, filing, forecast, or historical result.
Assume Company A starts with $100 million of free cash flow in Year 1. The base case assumes free cash flow grows by 8% per year for five years, then uses a terminal growth assumption after Year 5. A 10% discount rate is used to convert the future cash flows into present value.
| Year | Forecast free cash flow | Discount rate | Present value of cash flow |
|---|---|---|---|
| Year 1 | $100 million | 10% | $91 million |
| Year 2 | $108 million | 10% | $89 million |
| Year 3 | $117 million | 10% | $88 million |
| Year 4 | $126 million | 10% | $86 million |
| Year 5 | $136 million | 10% | $84 million |
The rounded present value of the five explicit cash-flow years is about $438 million. The terminal value is then estimated after Year 5 and discounted back to present value. If the present value of the terminal value is about $1.24 billion, the implied enterprise value is about $1.68 billion.
| DCF component | Rounded amount | Interpretation |
|---|---|---|
| Present value of explicit forecast cash flows | $438 million | Value from the first five forecast years. |
| Present value of terminal value | $1.24 billion | Value attributed to cash flows beyond the forecast window. |
| Enterprise value | $1.68 billion | Estimated value of the operating business before the equity bridge. |
Important limitation: the terminal value is a large part of this simplified result. That does not make the estimate wrong, but it does mean the conclusion depends heavily on long-term assumptions.
From enterprise value to per-share value
Enterprise value is not the same as common equity value. A DCF example must adjust for debt, cash, and other claims before the result can be translated into a per-share estimate.
In this hypothetical example, Company A has $200 million of debt and $50 million of cash. Net debt is therefore $150 million. Subtracting net debt from the $1.68 billion enterprise value gives about $1.53 billion of equity value. If the diluted share count is 100 million shares, the rounded per-share estimate is about $15.30.
| Bridge item | Rounded amount | Effect |
|---|---|---|
| Enterprise value | $1.68 billion | Starting value of the operating business. |
| Less net debt | $150 million | Debt above cash reduces value available to common equity. |
| Equity value | $1.53 billion | Value attributable to common equity in this simplified bridge. |
| Diluted shares | 100 million | Share count used to convert total equity value into a per-share estimate. |
| Per-share estimate | $15.30 | Illustrative output from the base-case assumptions. |
Interpretation: the per-share number is not the whole analysis. It is the result of one assumption set. A stronger DCF reading compares multiple assumption sets and asks which inputs are most defensible.
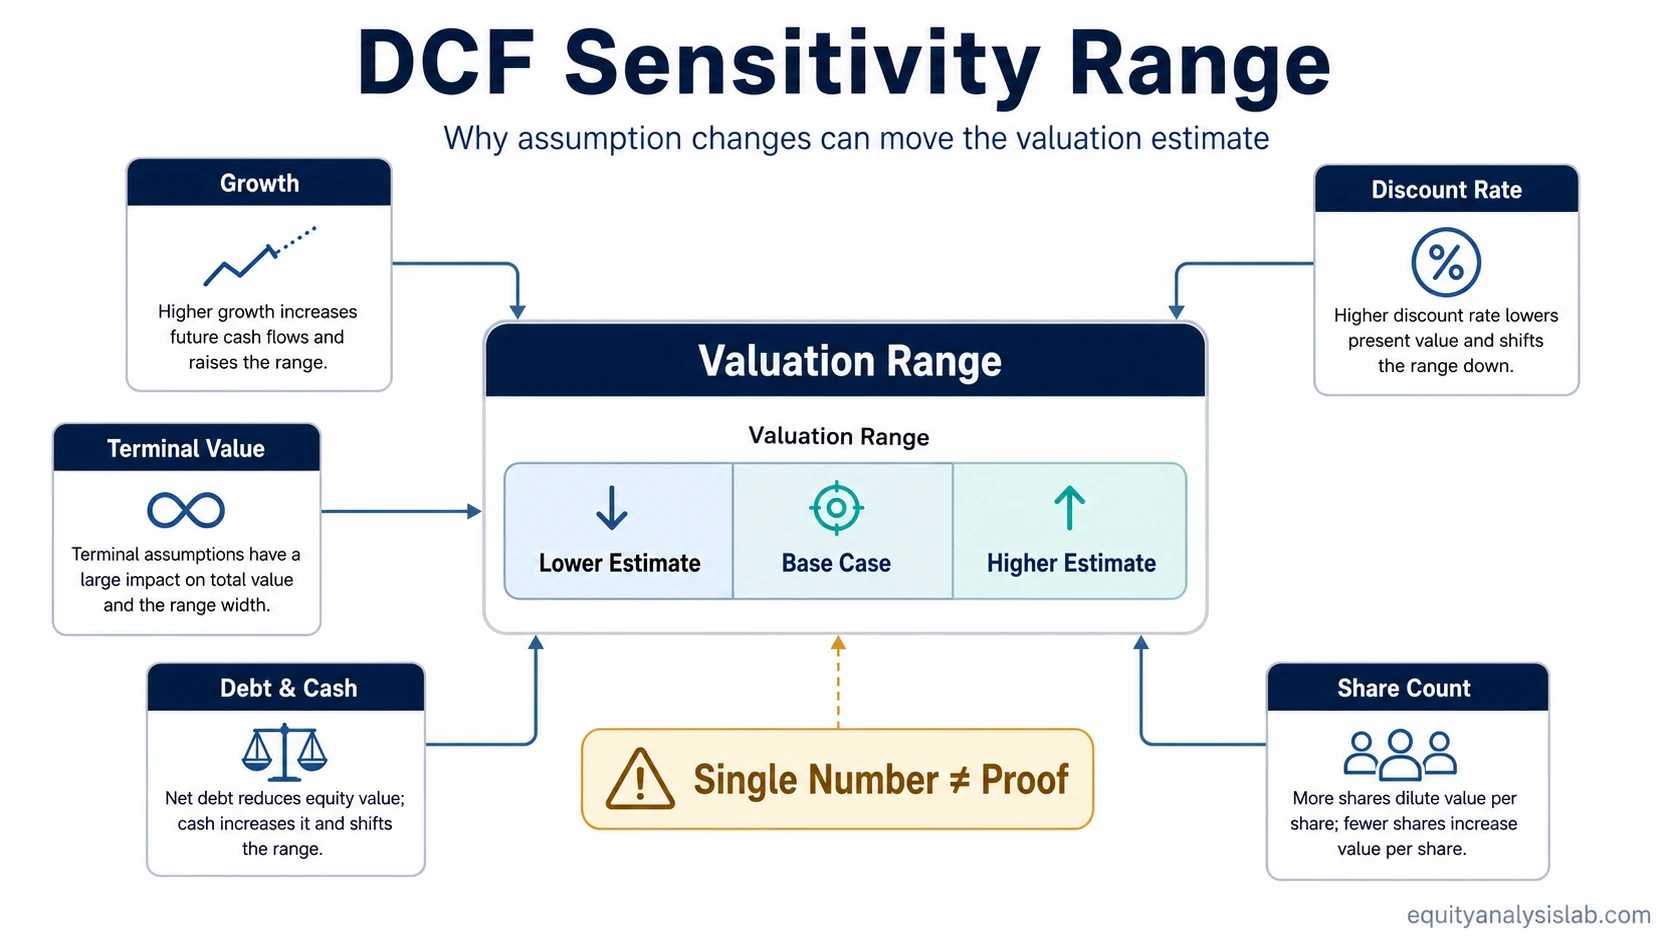
Why sensitivity matters
Sensitivity analysis shows how much the valuation changes when key assumptions move. In a DCF, the most important inputs are often free cash flow growth, discount rate, terminal value assumptions, net debt or cash, and diluted share count.
A valuation range is more useful than a single output because it shows the dependence of the estimate on assumptions. If small changes create a wide range, the model may be less precise than the spreadsheet presentation suggests.
| Scenario | Cash-flow growth | Discount rate | Terminal growth | Equity value | Per-share estimate |
|---|---|---|---|---|---|
| Lower case | 6% | 11% | 2.5% | $1.20 billion | $12.00 |
| Base case | 8% | 10% | 3.0% | $1.53 billion | $15.30 |
| Higher case | 10% | 9% | 3.5% | $2.05 billion | $20.50 |
The useful reading is not that the higher case is “right” and the lower case is “wrong”; it is that the spread shows which assumptions carry the most weight.
Valuation range: in this hypothetical example, the DCF output sits around $12.00 to $20.50 per share depending on the assumption set. That range is a decision aid for analysis, not proof that any one estimate is certain.
Common mistakes in reading a DCF example
A DCF model can create a false sense of precision because the output often looks exact. The real work is not typing numbers into a formula. The real work is judging whether the assumptions are reasonable, internally consistent, and supported by the company’s cash generation.
| Mistake | Why it weakens the analysis | Better interpretation |
|---|---|---|
| Treating one output as proof | One assumption set can make the result look more certain than it is. | Use a range and identify the assumptions that drive the spread. |
| Ignoring cash-flow quality | Weak or temporary cash flow can make the model look stronger than the business. | Separate durable cash generation from one-time or low-quality cash flow. |
| Using terminal value to force the answer | Small terminal changes can dominate the output. | Stress-test terminal growth or exit assumptions instead of relying on one long-term case. |
| Skipping the debt and cash bridge | Enterprise value and equity value can differ materially. | Adjust for net debt or net cash before interpreting per-share value. |
| Ignoring diluted share count | Total equity value can rise while per-share value is diluted. | Use diluted shares when dilution is economically relevant. |
Practical mistake: the model output is only as useful as the assumptions. A spreadsheet can be mathematically clean while the business assumptions remain weak.
What a DCF example cannot prove
A DCF example cannot prove that a business is high quality, that a forecast will occur, or that the market will eventually agree with the model. It can only show how a set of assumptions converts into an estimated range.
The method is most useful when it forces the analyst to separate operating performance, cash-flow durability, balance-sheet structure, and valuation sensitivity. A weak conclusion often appears when those inputs are blended into one polished output without enough testing.
Boundary: a DCF valuation example is an analytical framework. It does not replace company research, financial statement review, competitive analysis, or risk assessment.
Where to go deeper
The most useful next step is to separate the main DCF inputs and understand which part of the model each one controls.
| Concept | Why it matters in a DCF example | Study next |
|---|---|---|
| Free cash flow | Forms the main cash-flow base for the forecast. | Free cash flow |
| Discount rate | Converts future cash flows into present value. | Discount rate |
| Terminal value | Captures estimated value beyond the explicit forecast period. | Terminal value |
| Discounted cash flow | Defines the full valuation method behind the example. | Discounted cash flow method |
| Intrinsic value | Explains how estimated business value differs from quoted market price. | Intrinsic value |