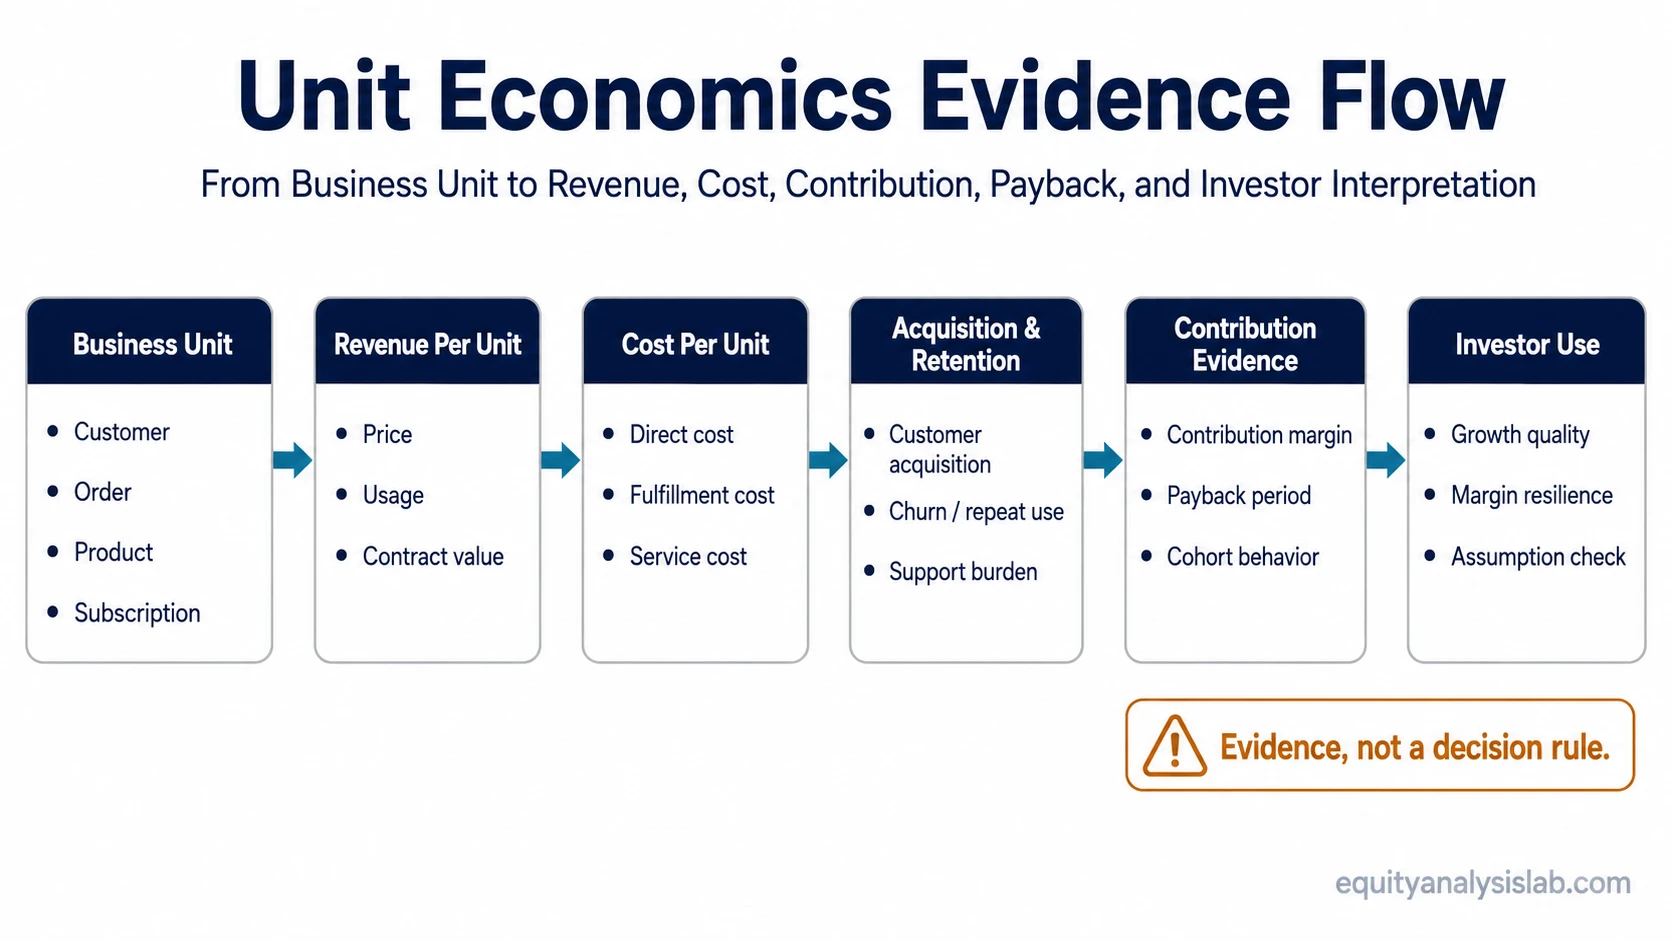
Unit economics shows whether a business creates or consumes economic value each time it sells one product, serves one customer, fulfills one order, or adds one subscription. In company analysis, the concept connects revenue, direct costs, acquisition costs, retention, and payback at the smallest meaningful level of the business.
Strong unit economics can support a business-quality thesis because growth is easier to evaluate when each additional unit contributes economic value. Weak unit economics can expose a model that depends on scale, subsidies, aggressive assumptions, or high acquisition spending. Neither reading is an investment decision by itself. Unit economics is evidence to test, not a shortcut to valuation, stock selection, or return expectations.
What Are Unit Economics?
Unit economics means the revenue, cost, and profit behavior of one measurable unit of a business. The unit may be a customer, order, product, subscription, account, shipment, transaction, or seat, depending on how the company earns revenue and incurs costs.
The basic question is simple: does one additional unit add value after the direct costs and acquisition costs required to produce, deliver, or win that unit? A company can report fast revenue growth while still showing weak unit economics if each new customer or order costs too much to acquire, serve, retain, or fulfill.
For investors, unit economics belongs inside broader business model analysis. It helps test whether growth is economically useful, but it does not explain the entire business model, the balance sheet, valuation, management quality, or competitive durability.
What Counts as a Unit?
The correct unit depends on the business model. A subscription company may analyze one subscriber or account. A marketplace may analyze one order or transaction. A retailer may analyze one customer, store visit, or product basket. A software company may analyze one seat, license, or customer cohort.
The unit should match the economic action that creates revenue and cost. If the wrong unit is chosen, the analysis can look precise while answering the wrong question. For example, average revenue per customer may hide the fact that small customers are unprofitable while large enterprise customers create most of the contribution value.
| Business model context | Possible unit | What the unit helps test |
|---|---|---|
| Subscription software | Subscriber, seat, account, or cohort | Whether recurring revenue offsets acquisition, support, hosting, and retention costs |
| E-commerce or retail | Order, product, basket, or customer | Whether selling and fulfilling each order leaves enough contribution after variable costs |
| Marketplace | Transaction, buyer, seller, or order | Whether take rate and repeat usage offset incentives, acquisition, support, and payment costs |
| Consumer service | Customer, booking, visit, or location | Whether repeat behavior and service delivery economics support profitable growth |
| Hardware or product business | Product, shipment, device, or installed customer | Whether gross profit, service revenue, and support costs justify production and acquisition costs |
How Unit Economics Are Calculated
Unit economics are usually calculated by comparing revenue per unit with the costs required to acquire, produce, deliver, and retain that unit. The formula depends on the business model, but the logic stays consistent: revenue must be evaluated against the costs directly tied to earning it.
| Input | Basic formula or interpretation | Investor-use note |
|---|---|---|
| Revenue per unit | Revenue divided by the relevant unit count | Shows the average value captured from one customer, order, product, account, or transaction |
| Variable cost per unit | Direct cost tied to producing, serving, or fulfilling one unit | Separates revenue growth from the cost required to deliver that revenue |
| Contribution margin per unit | Revenue per unit minus variable cost per unit | Shows whether the unit contributes value before fixed overhead, corporate expense, and financing costs |
| Customer acquisition cost | Sales and marketing cost divided by new customers or acquired units | Helps test whether growth is being purchased at a sustainable cost |
| Customer lifetime value | Expected contribution value from a customer over the expected relationship period; revenue-based LTV should be labeled clearly and not treated as profitability | Depends heavily on retention, churn, margin, pricing, and customer behavior assumptions |
| LTV:CAC | Customer lifetime value divided by customer acquisition cost | Compares expected customer value with acquisition cost, but should not be treated as a universal benchmark |
| Payback period | Time needed to recover acquisition cost from contribution value | Shows how quickly growth spend converts into unit-level economic recovery |
| Retention or churn | Customer persistence or customer loss over time | Changes the reliability of LTV, payback, and growth-quality assumptions |
A simple contribution-margin version is:
Contribution margin per unit: revenue per unit minus variable cost per unit.
Unit-level value after acquisition: lifetime contribution value minus customer acquisition cost.
These formulas are useful only when the inputs are defined consistently. A company that excludes fulfillment costs, customer support, incentives, refunds, payment processing, or onboarding expense may show unit economics that look stronger than the underlying economics justify.
Why Unit Economics Matter in Company Analysis
Unit economics matters because growth can hide economic weakness. A company may add customers quickly, expand reported revenue, and still create little value if acquisition costs rise, retention weakens, or each unit carries too much variable cost.
Investors use unit economics to test whether growth has quality behind it. The concept can help separate a business that becomes more attractive as it scales from a business that needs constant spending, discounts, or favorable assumptions to keep reported growth moving.
Investor Unit Economics Evidence Check
| Input investors want | What it can show | Where the data may come from | How it can mislead |
|---|---|---|---|
| Revenue per unit | Whether each unit generates enough revenue to support the model | Segment revenue, customer metrics, ARPU, order value | Averages can hide weak cohorts, weaker regions, or low-quality segments |
| Variable cost per unit | Whether delivery costs scale with growth | Cost of revenue, gross margin, fulfillment cost, disclosed unit cost | Some costs may be excluded, delayed, capitalized, or reclassified |
| Contribution margin | Whether a unit contributes value after direct costs | Contribution margin disclosure or gross profit proxy | Contribution margin is not the same as fully loaded profitability |
| CAC | Cost to acquire a customer or unit of demand | Sales and marketing intensity, disclosed CAC, customer acquisition disclosures | Brand spend, channel mix, promotions, and timing can distort acquisition cost |
| LTV | Potential value of a retained customer | Retention, churn, cohort, renewal, or repeat-purchase disclosure | Over-optimistic retention can inflate lifetime value |
| Payback period | How quickly acquisition cost is recovered | Management disclosure or inferred sales-efficiency data | Growth timing can make payback look better or worse than normalized economics |
Unit economics also helps connect growth quality with management choices. A company with strong unit-level economics can still damage shareholder value if capital is deployed poorly, so unit-level strength should later be weighed against capital deployment decisions.
What Strong or Weak Unit Economics Can Indicate
Strong unit economics can indicate that the company captures enough value from each customer, order, product, or subscription to support growth. The evidence becomes more useful when it is visible across cohorts, segments, customer types, or time periods instead of appearing only in a blended average.
Weak unit economics can indicate that the company is buying growth, relying on temporary subsidies, underpricing the product, absorbing high service costs, or assuming future retention that has not yet been demonstrated. Weak unit-level data does not automatically mean the stock is unattractive, but it raises questions about scalability, margin quality, and the durability of reported growth.
| Signal | Possible interpretation | Boundary |
|---|---|---|
| Revenue per unit rises while variable cost per unit is stable | Pricing, mix, customer quality, or scale may be improving unit-level economics | The conclusion still needs margin and retention support |
| CAC rises faster than contribution value | Growth may be becoming more expensive or less efficient | Temporary channel investment can distort short periods |
| Retention weakens while LTV assumptions stay high | Lifetime value may be overstated | Disclosure quality matters because churn can be measured differently |
| Contribution margin improves while revenue grows | Scale or mix may be improving direct economics | Fixed costs, stock-based compensation, and corporate overhead still matter |
| Average unit economics look attractive but customer mix is concentrated | Reported averages may depend heavily on a small group of customers | Fragility may be better analyzed through revenue dependence and account risk |
Attractive averages can still be fragile if too much revenue depends on a small number of customers, contracts, or accounts. That risk belongs closer to customer dependence and revenue concentration than to the unit formula itself, so revenue dependence on a narrow customer base should be assessed separately.
Where Unit Economics Can Mislead Investors
Unit economics can look cleaner than the business really is when the inputs are incomplete, selective, or based on aggressive assumptions. The most common problem is not the formula. The problem is the quality of the numerator, denominator, and time period used in the formula.
Unrealistic retention: LTV can look high if customer life is assumed to be longer than actual behavior supports.
Undercounted variable costs: fulfillment, customer support, onboarding, refunds, incentives, hosting, or payment costs may be excluded from the unit calculation.
Blended averages: strong customers, regions, products, or cohorts can hide weak unit economics elsewhere in the business.
CAC timing distortion: sales and marketing spend often occurs before revenue arrives, so short periods can overstate or understate acquisition efficiency.
Contribution margin confusion: positive contribution margin does not prove net profitability after fixed costs, research, administration, financing, tax, and corporate overhead.
Another limitation is disclosure. For public companies, the analysis is often indirect because customer-level CAC, cohort retention, and contribution margin may be disclosed selectively, inconsistently, or not at all. Investors may need to infer unit behavior from segment revenue, gross margin, sales and marketing intensity, disclosed retention, cohort commentary, ARPU, order value, churn, or management discussion. Inferred unit economics should be treated as an estimate, not as a precise fact.
Unit Economics vs Related Business Quality Concepts
Unit economics is only one part of business-quality analysis. It can support a view about business quality, but it should not absorb every question about competitive advantage, pricing, customer risk, or management behavior.
| Concept | Main question | How it differs from unit economics |
|---|---|---|
| Unit economics | Does one unit create economic value after relevant revenue and costs? | Focuses on the revenue and cost behavior of a customer, order, product, subscription, or transaction |
| Business model analysis | How does the whole company make money and sustain the model? | Broader than unit economics because it includes revenue architecture, cost structure, distribution, incentives, and scalability |
| Pricing power | Can the company raise prices or defend margins without losing too much demand? | Can improve unit economics, but does not by itself explain acquisition cost, retention, or variable cost behavior |
| Economic moat | Can the company defend returns against competition over time? | Unit-level evidence may support durable advantage, but durable competitive advantage requires separate evidence |
| Capital allocation | How does management use cash, reinvestment, debt, buybacks, and acquisitions? | Strong unit economics can create attractive reinvestment opportunities, but management still must allocate capital well |
Simple Unit Economics Example
Assume a subscription business earns $40 per month from one customer and spends $14 per month in direct service, hosting, support, and payment costs. The monthly contribution margin is $26 per customer before corporate overhead. If the company spends $180 to acquire that customer, the simple payback period is about seven months before considering churn, expansion, discounts, or support escalation.
The same example can change sharply if retention is weaker than expected. A customer who stays for three years may create attractive lifetime contribution value. A customer who cancels after four months may not recover acquisition cost. The investor question is not whether the formula looks good in isolation. The question is whether the assumptions behind revenue, direct cost, retention, and acquisition cost are visible and credible.
SaaS businesses often use LTV, CAC, churn, payback, and cohort retention because recurring revenue makes customer life important. The same logic can also apply to order-level economics in retail, transaction-level economics in marketplaces, or product-level gross profit in hardware and product businesses.
FAQ
What is unit economics in simple terms?
Unit economics is the revenue and cost behavior of one measurable unit of a business, such as one customer, order, product, subscription, or transaction. It shows whether that unit adds economic value after the relevant costs are considered.
How do you calculate unit economics?
The calculation depends on the business model, but a basic version compares revenue per unit with variable cost per unit, contribution margin, acquisition cost, retention, lifetime value, and payback period. The key is to define the unit consistently before interpreting the formula.
What is a good unit economics ratio?
A good ratio depends on the business model, sector, margin structure, retention profile, and reporting period. A ratio such as LTV:CAC can be useful, but universal benchmarks can mislead when customer life, cost structure, and disclosure quality differ across companies.
Why do investors look at unit economics?
Investors look at unit economics to test whether growth creates value at the customer, order, product, subscription, or transaction level. The metric helps reveal whether revenue growth is supported by contribution value, acquisition efficiency, retention, and scalable delivery costs.
Can strong unit economics prove that a stock is attractive?
No. Strong unit economics can support a business-quality argument, but stock attractiveness also depends on valuation, balance sheet risk, management decisions, competition, disclosure quality, and future expectations.