An income statement is one of the core financial statements. It reports a company’s revenue, expenses, gains, losses, taxes, and net income over a reporting period.
Investors use the income statement to understand profitability and operating performance. The statement is most useful when it is read alongside cash-flow and balance-sheet evidence, because reported profit does not automatically prove cash generation, financial strength, or investment attractiveness.
Key Points
- An income statement reports financial performance over a period, such as a quarter or fiscal year.
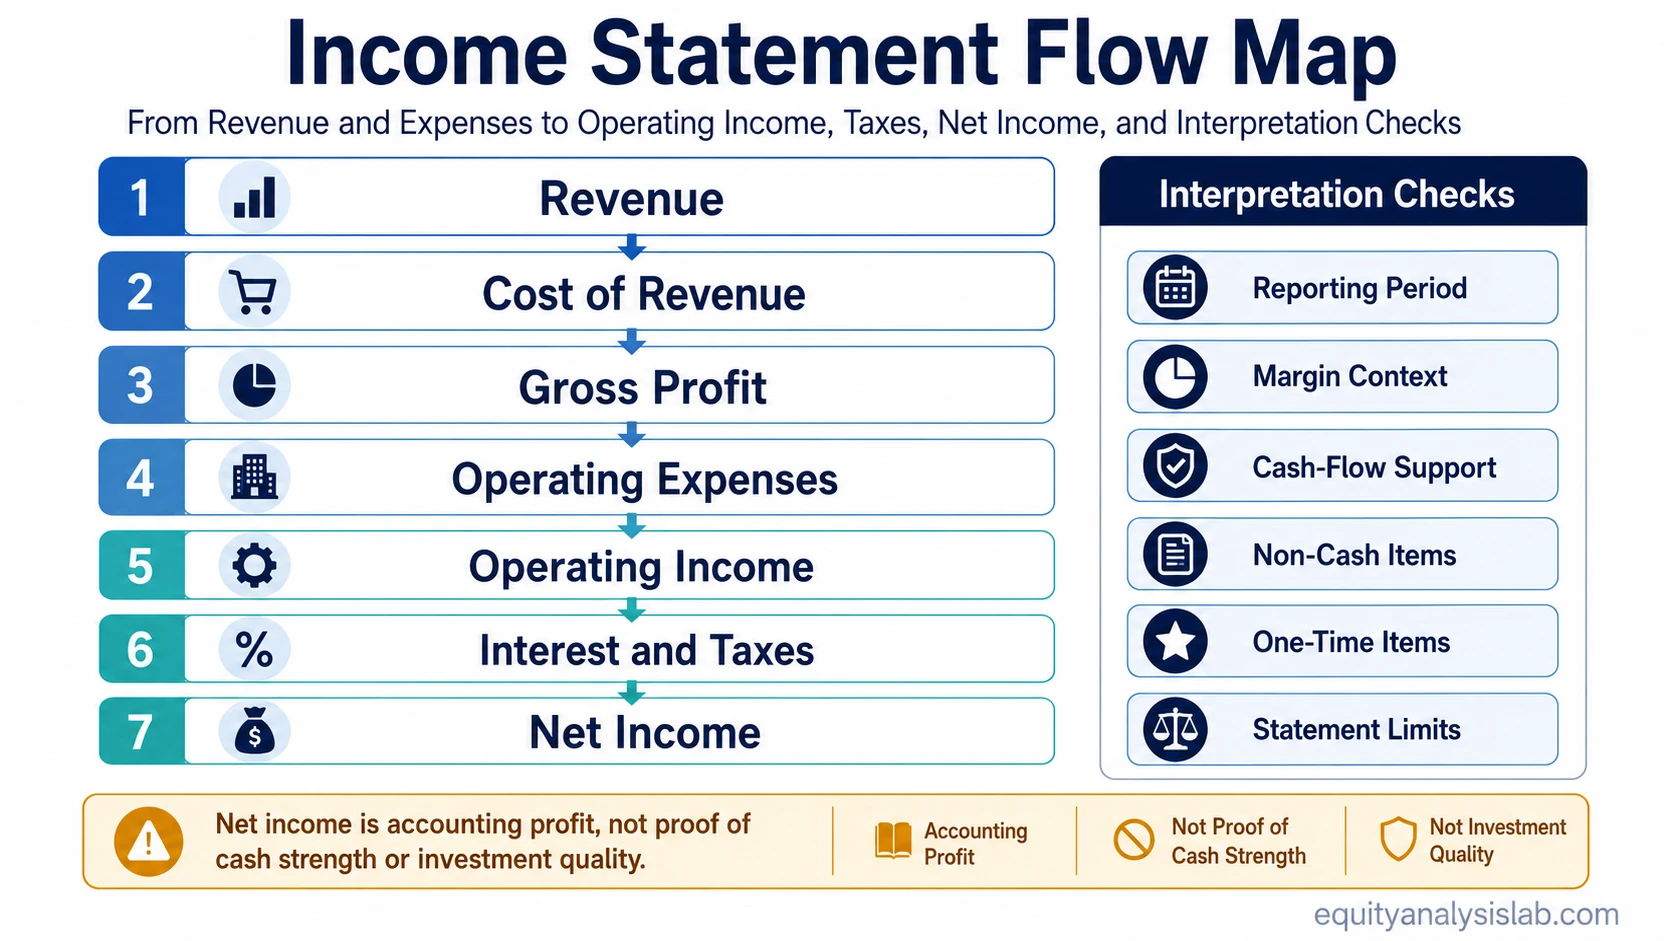
- It starts with revenue and works down through expenses, gains or losses, taxes, and net income.
- It helps investors study profitability, cost structure, margins, and operating performance.
- It does not prove cash generation or business quality by itself.
- Cash flow and balance sheet checks are needed before treating reported profit as economic strength.
What Is an Income Statement?
An income statement is a financial report that summarizes how much revenue a company generated, what costs and expenses it incurred, and how much profit or loss remained during a defined reporting period. It is also commonly called a profit and loss statement, or P&L.
The statement is period-based. A quarterly income statement covers activity during that quarter, while an annual income statement covers activity during the fiscal year. This is different from the balance sheet, which shows assets, liabilities, and equity at a specific point in time.
The basic logic is simple: revenue enters at the top, costs and expenses are subtracted, and the remaining amount becomes net income or net loss. The interpretation is less simple because accounting rules, timing differences, non-cash expenses, one-time items, and business model differences can change what the numbers mean.
Where the Income Statement Fits With Other Financial Statements
The income statement is one part of the financial statement set. It focuses on performance, while other statements answer different questions about the same company.
| Statement | Main question answered | Timing view | Investor use |
|---|---|---|---|
| Income statement | Was the company profitable during the period? | Over a period | Revenue growth, margins, expense structure, net income |
| Balance sheet | What does the company own, owe, and retain? | At a point in time | Assets, liabilities, equity, liquidity, leverage |
| Cash flow statement | How did cash move through the business? | Over a period | Operating cash flow, investing cash flow, financing cash flow |
The income statement can show accounting profit, but the cash flow statement helps test whether that profit was supported by actual cash generation.
Main Income Statement Line Items
Income statement line items vary by company, sector, and reporting format, but most statements follow a top-to-bottom flow from revenue to net income.
| Line item | What it shows | How investors often read it |
|---|---|---|
| Revenue | Sales or income generated from customers and other operating sources. | Top-line scale, demand, pricing, and business activity. |
| Cost of revenue | Direct costs tied to producing goods or delivering services. | Input cost pressure, production efficiency, or service delivery cost. |
| Gross profit | Revenue left after cost of revenue. | Gross margin and the basic economics of selling the product or service. |
| Operating expenses | Expenses such as selling, general, administrative, research, and development costs. | Operating discipline, reinvestment, scale, and cost structure. |
| Operating income | Profit from core operations before non-operating items and taxes. | Core business profitability before financing and tax effects. |
| Interest expense | Cost of debt financing. | Debt burden and sensitivity to financing costs. |
| Taxes | Income tax expense for the period. | Effective tax rate and differences between pre-tax and after-tax profit. |
| Net income | Profit or loss after all income statement items. | Bottom-line profit available for further per-share, quality, and cash-flow analysis. |
Income Statement Formula and Line-Item Flow
The broad income statement formula is:
Net income = Revenue − Expenses ± Gains or losses − Taxes
Many companies use a more detailed flow that separates gross profit, operating income, and net income:
Revenue − Cost of revenue = Gross profit
Gross profit − Operating expenses = Operating income
Operating income ± Non-operating items − Interest − Taxes = Net income
This structure helps investors see where profit is being created or lost. A company may grow revenue but still report weaker net income if costs rise faster than sales, interest expense increases, tax expense changes, or non-operating losses affect the period.
Sample Income Statement
The following simplified example is hypothetical. It is designed to show line-item flow, not to represent a real company or a complete accounting statement.
| Line item | Amount | Reading |
|---|---|---|
| Revenue | $1,000 | Total sales or operating income for the period. |
| Cost of revenue | ($400) | Direct cost of producing goods or delivering services. |
| Gross profit | $600 | Revenue remaining after direct costs. |
| Operating expenses | ($300) | Costs needed to run and develop the business. |
| Operating income | $300 | Profit from core operations before interest and taxes. |
| Interest expense | ($40) | Cost of debt financing. |
| Income tax expense | ($60) | Tax cost recognized for the period. |
| Net income | $200 | Bottom-line accounting profit for the period. |
In this simplified example, the company turns $1,000 of revenue into $200 of net income. The income statement shows the accounting result, but it does not show whether the company collected the cash, how much debt it carries, or whether the profit level is durable.
Single-Step vs Multi-Step Income Statement
An income statement may be presented in a single-step or multi-step format. Both formats report performance over a period, but they organize the path to net income differently.
| Format | How it works | What it emphasizes |
|---|---|---|
| Single-step income statement | Groups revenues and gains, then subtracts expenses and losses. | A simpler view of total income minus total costs. |
| Multi-step income statement | Separates gross profit, operating income, non-operating items, taxes, and net income. | A more detailed view of operating performance and cost structure. |
For investor analysis, the multi-step format is often more useful because it separates operating performance from financing effects, taxes, and non-operating items. The single-step format can still be useful for a quick profit overview, especially for simpler businesses.
How Investors Read an Income Statement
Investors usually do not read an income statement only to find net income. They use it to understand the path from revenue to profit and to test whether performance is improving, weakening, or being distorted by temporary factors.
| Analysis lens | Question to ask | Why it matters |
|---|---|---|
| Revenue trend | Is revenue growing, shrinking, or volatile? | Shows whether the company is expanding activity before cost effects. |
| Gross margin | How much revenue remains after direct costs? | Helps identify pricing power, cost pressure, and product economics. |
| Operating margin | How much profit remains after operating expenses? | Shows how efficiently the company turns gross profit into operating profit. |
| Net margin | How much revenue becomes net income? | Shows bottom-line profitability after all income statement effects. |
| Expense structure | Which costs are growing faster than revenue? | Can reveal reinvestment, inefficiency, inflation pressure, or operating leverage. |
| Non-recurring items | Are gains, losses, restructuring costs, or impairments affecting the period? | Helps separate recurring operations from unusual period effects. |
Cash-Flow Support and Earnings Quality
Net income is an accrual accounting measure. It can include revenue recognized before cash collection, expenses spread across periods, and non-cash charges such as depreciation or amortization.
That is why income statement analysis should be checked against operating cash flow and cash remaining after capital spending. A company with rising net income but weak cash conversion may require closer review of working capital, receivables, inventory, capital expenditures, or accounting assumptions.
Debt can also affect interpretation. Higher interest expense may reduce net income even when operating income is stable. For that reason, leverage and interest-cost analysis can help explain why profitability changes from operating income to net income.
What an Income Statement Can and Cannot Show
The income statement is useful, but it is not a complete picture of a company.
| Can show | Cannot show by itself |
|---|---|
| Revenue, expenses, gains, losses, and net income for a period. | Cash collected or spent during the same period. |
| Gross, operating, and net profitability. | Balance-sheet strength, liquidity, or debt maturity risk. |
| Cost structure and margin changes. | Whether the company is fairly valued or attractive as an investment. |
| Accounting profit or loss under reporting rules. | Whether profit is recurring, cash-supported, or durable. |
A stronger interpretation usually combines the income statement with the balance sheet, cash flow statement, segment disclosures, notes to the financial statements, and management discussion where available.
Common Mistakes When Reading an Income Statement
Mistake 1: Treating net income as cash. Net income is accounting profit, not the same as operating cash flow or free cash flow.
Mistake 2: Ignoring the period boundary. A quarter can be distorted by seasonality, timing, restructuring costs, impairments, or unusual gains and losses.
Mistake 3: Comparing margins without context. A high or low margin has to be read against business model and industry context.
Mistake 4: Overlooking classification choices. Companies may classify costs differently across line items, and line-item labels may vary. Similar names do not always mean identical economics.
Mistake 5: Reading profit without the other statements. The income statement should be checked against cash flow, liquidity, leverage, and asset quality before drawing conclusions about business strength.
Related Financial Statement Concepts
The income statement is strongest when it is read as part of the full financial statement set. The balance sheet adds financial position, liquidity, debt, assets, and equity. The cash flow statement adds cash movement and helps test whether reported profit becomes cash.
Free cash flow adds another layer by showing how much cash remains after capital expenditures. Debt analysis adds context when interest expense, leverage, maturities, or refinancing risk materially affect profitability.
EBIT and EBITDA can also appear in income-statement analysis, but they should be treated as related profitability measures rather than substitutes for the income statement itself.
FAQ
What is an income statement in simple terms?
An income statement is a financial report that shows a company’s revenue, expenses, gains, losses, taxes, and net income over a reporting period. It helps show whether the company was profitable during that period.
Is an income statement the same as a profit and loss statement?
Yes. An income statement is often called a profit and loss statement, or P&L. Both terms refer to a statement that reports revenue, expenses, and profit or loss over a period.
How is an income statement different from a balance sheet?
An income statement reports performance over a period. A balance sheet reports financial position at a point in time, including assets, liabilities, and equity.
How is an income statement different from a cash flow statement?
An income statement reports accounting profit or loss. A cash flow statement reports cash inflows and outflows, which can differ from net income because of accrual accounting, working-capital timing, and non-cash expenses.
Does net income prove that a company is financially strong?
No. Net income is an important profitability measure, but it does not prove cash generation, balance-sheet strength, earnings durability, or investment attractiveness by itself.