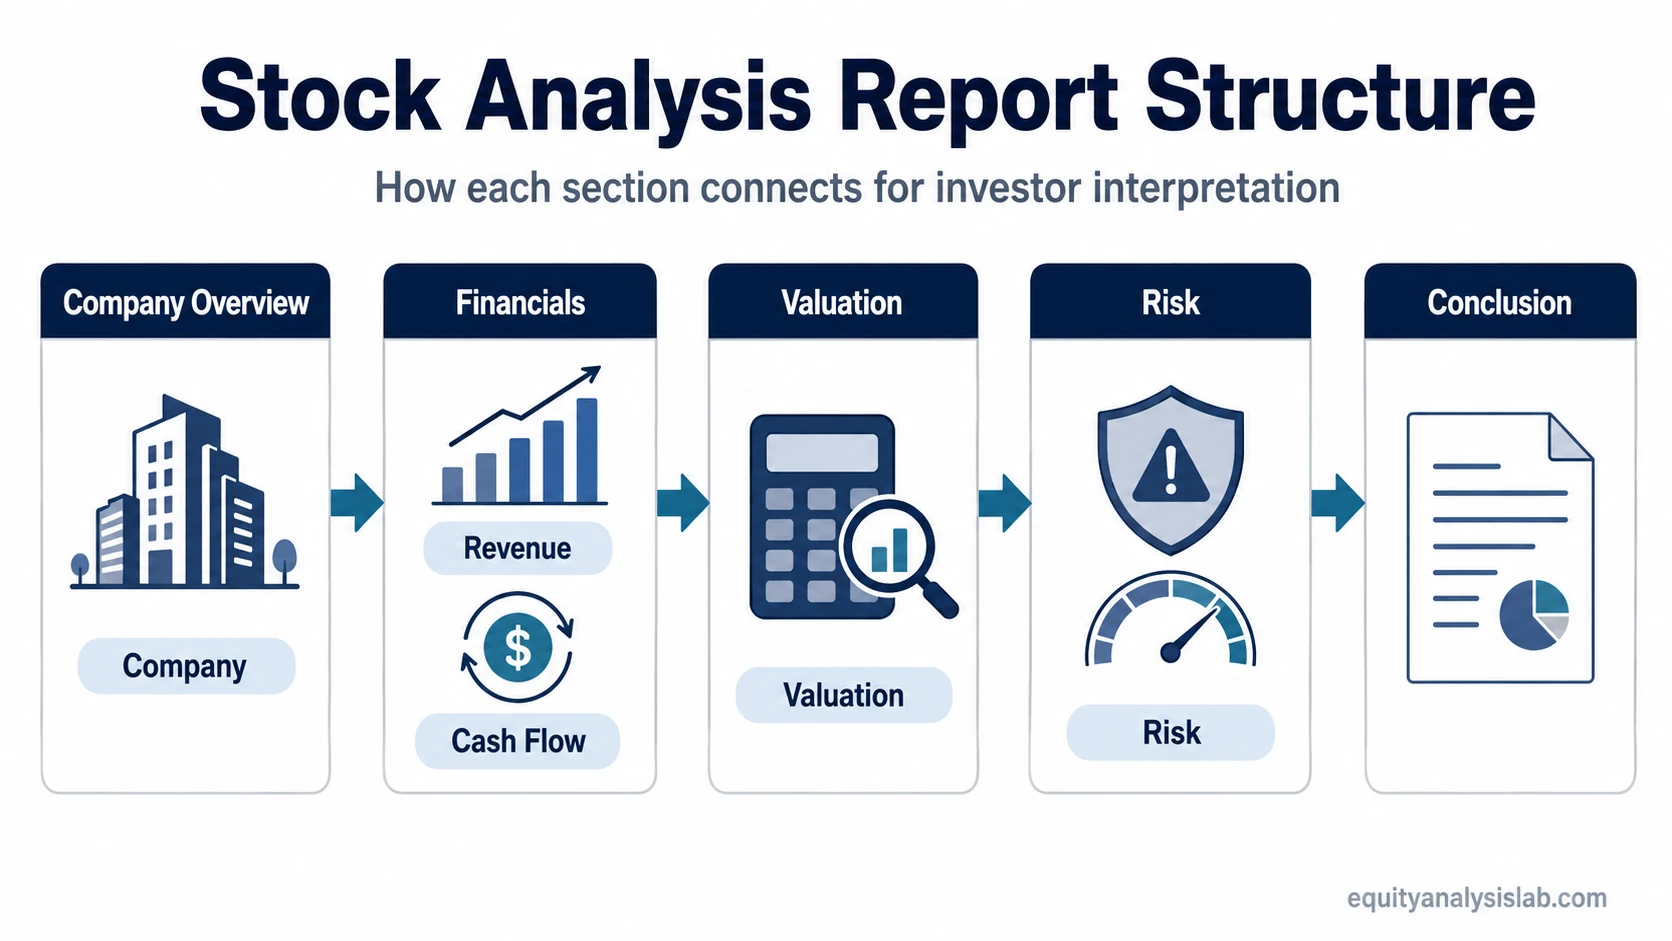
A stock analysis report example shows how company background, financial statements, valuation, risk review, and conclusion work together inside an investor research document.
The useful part is not copying a rating or a final opinion. The useful part is seeing how each section answers a different investor question: what the business does, whether the numbers support the story, how valuation assumptions affect the estimate, and what could make the conclusion wrong.
This example uses a neutral educational structure. It does not provide a stock recommendation, target price, buy signal, sell signal, or portfolio instruction.
Key Points
- A stock analysis report example should show the logic behind the conclusion, not only the conclusion itself.
- The core sections usually include company overview, business quality, financials, valuation, risks, and interpretation.
- Financial analysis should connect revenue, margins, earnings, cash flow, and balance-sheet risk instead of treating each metric separately.
- Valuation should be read as a range or scenario exercise because assumptions can change the result materially.
- A good example separates evidence, assumptions, interpretation, and uncertainty before any final view appears.
What a Stock Analysis Report Example Should Include
A stock analysis report example should make the research process visible. It should show how an analyst moves from business description to financial evidence, from financial evidence to valuation, and from valuation to a cautious interpretation of risk and reward.
The strongest examples do not treat the final conclusion as the main lesson. A conclusion such as positive, neutral, cautious, undervalued, or overvalued only becomes useful when the reader can see which assumptions support it and which risks could weaken it.
For an investor, the report format is a checklist for reasoning. Each section should answer one clear question and expose one possible source of error.
Sample Stock Analysis Report Format
The table below shows a practical report format. It is written as a reusable educational example, not as a recommendation for any specific company.
| Report section | Example wording | What the section tests |
|---|---|---|
| Company snapshot | The company earns revenue from recurring subscriptions and professional services. The report should separate recurring revenue from one-time implementation revenue because the two streams may deserve different interpretation. | Whether the business model is durable, understandable, and tied to repeatable demand. |
| Business quality | The company may have customer stickiness, but the report should test whether that stickiness comes from real switching costs, product depth, brand strength, or simple customer inertia. | Whether the company has a defensible advantage or only a strong narrative. |
| Revenue review | Revenue growth appears positive, but the report should ask whether growth came from pricing, volume, acquisitions, or temporary demand. | Whether growth quality is strong enough to support the thesis. |
| Margin review | Margins may compress even while revenue grows. That can signal reinvestment, cost pressure, weak pricing power, or operating inefficiency depending on the context. | Whether profitability supports or contradicts the growth story. |
| Cash flow review | Free cash flow should be compared with reported earnings. If earnings rise while cash flow lags, the report should examine working capital, capital expenditure, and revenue recognition. | Whether reported profit is supported by cash generation. |
| Balance-sheet review | Debt, cash, maturity schedule, and interest burden should be reviewed before treating valuation upside as attractive. | Whether financial risk could limit flexibility or weaken the thesis. |
| Valuation method | The report may use DCF, peer multiples, or both. The method should match the business profile and the quality of available assumptions. | Whether the valuation approach is suitable for the company being analyzed. |
| Risk factors | The report should explain which events would weaken the thesis, such as slower growth, margin pressure, dilution, debt stress, or competitive loss. | Whether the conclusion has clear boundaries and uncertainty is visible. |
| Interpretation | The final view should connect evidence, assumptions, and risks. A single valuation estimate should not be presented as proof. | Whether the conclusion follows from the analysis instead of sounding detached from it. |
Main Sections of a Stock Analysis Report
Each section of a stock analysis report should do a specific job. If the report only describes the company, it is not yet analysis. If it only calculates valuation, it may miss business quality. If it only lists risks, it may fail to explain which risks matter most.
| Section | Investor question | Common mistake | Deeper concept |
|---|---|---|---|
| Company overview | What does the business do, who pays it, and why does demand exist? | Treating a strong story as proof of a strong business. | economic moat |
| Income statement | Are revenue, margins, and earnings moving in a way that supports the thesis? | Reading revenue growth as automatically positive. | income statement |
| Cash flow | Do reported earnings convert into cash? | Ignoring working capital, reinvestment needs, or weak cash conversion. | free cash flow |
| Balance sheet | Does leverage, liquidity, or dilution change the risk profile? | Looking at upside without checking financial flexibility. | balance sheet |
| Valuation | What assumptions are required for the estimated value to make sense? | Presenting one valuation number as if it were precise. | discounted cash flow |
| Value interpretation | How should the estimate be interpreted relative to uncertainty? | Confusing valuation output with an investment recommendation. | intrinsic value |
| Risk and conclusion | What could make the thesis wrong? | Listing generic risks without connecting them to assumptions. | investment research process |
Mini Stock Analysis Report Example
Assume a sample company has growing revenue, stable customer demand, and improving product adoption. A weak report might stop there and describe the company as attractive. A stronger report asks whether revenue growth is profitable, whether earnings are supported by cash flow, whether debt changes the risk profile, and whether valuation already reflects the good news.
For example, revenue may grow while gross margin falls. That does not automatically make the company weak, but it changes the question. The analyst should check whether margin pressure comes from temporary investment, higher input costs, lower pricing power, or an unfavorable shift in product mix.
The same company may report higher earnings while free cash flow remains weak. That can happen when working capital absorbs cash, capital expenditure rises, or reported profit includes items that do not translate into durable cash generation. The report should not treat earnings and cash flow as interchangeable.
A useful conclusion would not say that the company is simply good or bad. It would say that the thesis depends on whether revenue growth converts into durable margins and cash flow, and whether the valuation assumptions remain reasonable under more cautious scenarios.
How the Financial Section Works
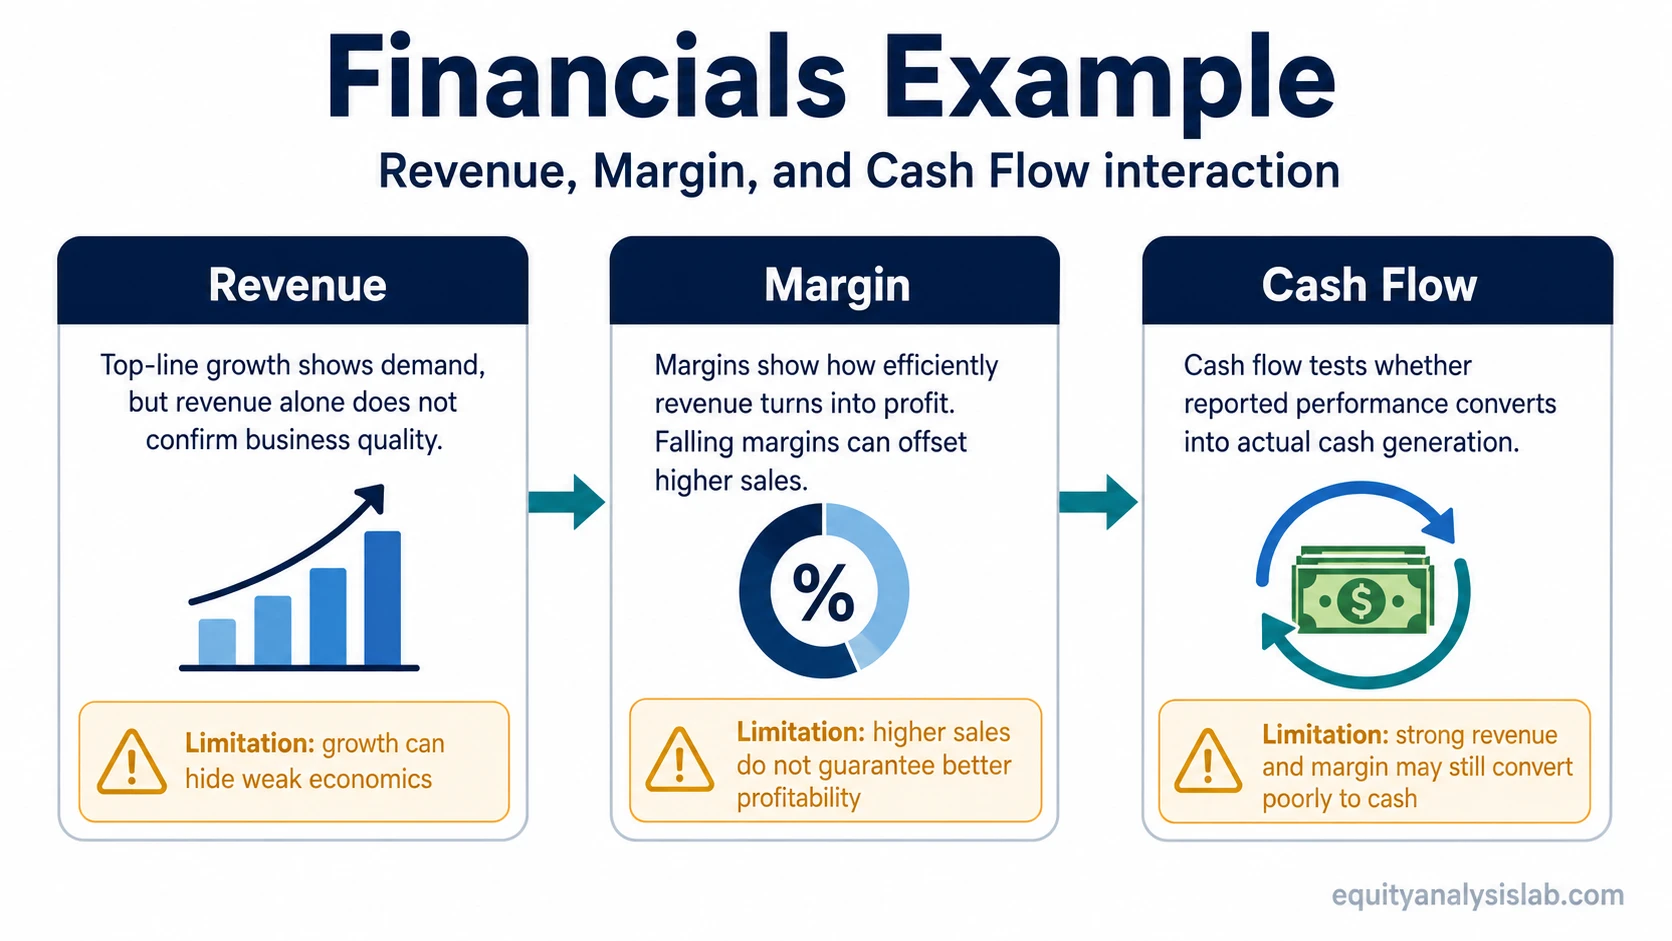
The financial section is where the report checks whether the business story appears in the numbers. Revenue, margin, earnings, cash flow, and debt should be read together because each metric can change the meaning of the others.
Revenue growth is more useful when it is supported by pricing power, customer retention, or expanding demand. It becomes less convincing when growth depends on heavy discounting, acquisitions, temporary demand, or dilution that weakens per-share economics.
Margins show whether growth is translating into profitability. A margin decline may be acceptable if it reflects productive reinvestment, but it becomes a warning sign if the company is losing pricing power or needs more spending simply to maintain growth.
Cash flow tests earnings quality. If profit rises but free cash flow does not follow, the report should slow down and explain why. This is often where a stock analysis example becomes useful because it shows the difference between accounting performance and economic performance.
How the Valuation Section Works
The valuation section translates business assumptions into an estimated value range. It should not make the report look more certain than the evidence allows.
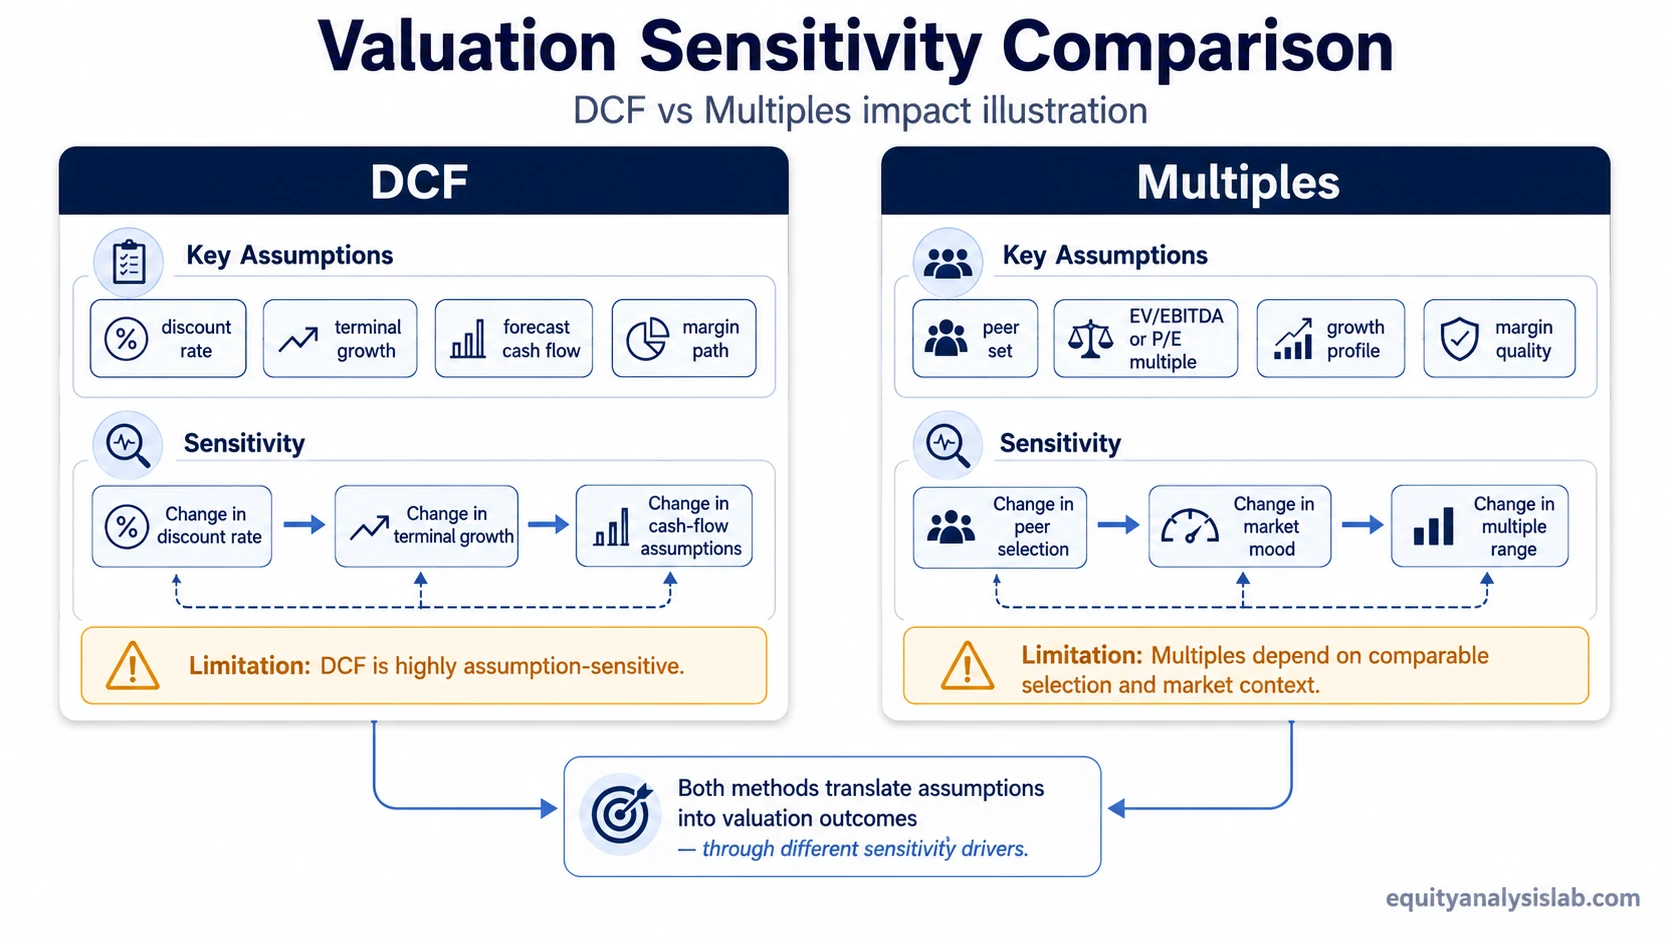
A discounted cash flow model depends on assumptions about revenue growth, operating margins, reinvestment, discount rate, and terminal value. A relative valuation depends on peer selection, multiple quality, and whether the company deserves a premium, discount, or market-level multiple.
The most important part of valuation is not the final number. It is the sensitivity of the result. If small changes in margin, growth, discount rate, or terminal value produce a large change in estimated value, the report should make that uncertainty visible.
DCF vs Multiples in a Stock Analysis Report
A stock analysis report may use more than one valuation method because each method answers a different question. DCF focuses on long-term cash-flow assumptions. Multiples compare the company with similar businesses or market expectations.
| Valuation method | What it is useful for | Main weakness | How to interpret it |
|---|---|---|---|
| DCF | Connecting company-specific forecasts to estimated intrinsic value. | Highly sensitive to long-term assumptions and discount rate. | Best read as a scenario range, not a single precise answer. |
| Peer multiples | Comparing market pricing across similar companies. | Can be misleading if peers differ in growth, margins, risk, or accounting quality. | Best used as a market-context check, not as proof of value. |
| Enterprise value | Comparing business value while considering debt and cash. | Can still miss differences in asset quality, cyclicality, and reinvestment needs. | Useful when capital structure changes the equity-level picture. |
Common Mistakes in Stock Analysis Report Examples
- Copying the conclusion: A sample report is useful for structure, not for copying a rating or opinion.
- Ignoring assumptions: Valuation outputs depend on growth, margin, discount-rate, and terminal assumptions.
- Treating revenue growth as enough: Growth matters more when it converts into durable margin and cash flow.
- Skipping balance-sheet risk: Debt, dilution, and liquidity can change the interpretation of valuation upside.
- Reading risks as boilerplate: Risk factors should connect directly to the thesis and valuation assumptions.
- Confusing report format with investment advice: The structure helps organize analysis; it does not decide what an investor should do.
How to Read the Conclusion Without Copying It
The conclusion of a stock analysis report should be read as the output of a reasoning process. It may summarize whether the business appears strong, whether valuation seems demanding or reasonable, and which risks matter most.
The conclusion should not be separated from the assumptions that produced it. A report can sound confident while depending on aggressive growth, margin recovery, multiple expansion, or unusually favorable cash-flow assumptions.
A useful reader asks three questions before accepting any conclusion: what must be true for this view to work, what evidence would weaken it, and how sensitive is the valuation to small changes in assumptions?
Educational Use Only
This stock analysis report example is designed to explain research structure and investor interpretation. It does not recommend buying, selling, holding, shorting, or avoiding any security. Any real investment decision requires current company filings, updated financial data, valuation work, and personal suitability review.
Stock Analysis Report Example FAQ
What is the purpose of a stock analysis report example?
A stock analysis report example helps readers understand how a report is organized. It shows how company overview, financials, valuation, risks, and conclusion connect inside an investor research process.
Should a stock analysis report example include a recommendation?
Professional reports may include a rating or recommendation, but an educational example does not need one. The more useful part is the evidence, assumptions, valuation sensitivity, and risk logic behind any conclusion.
What is the most important section of a stock analysis report?
No single section is enough on its own. The strongest reports connect business quality, financial performance, cash flow, valuation, and risk so that the conclusion follows from the evidence.
Why can valuation differ between reports?
Valuation can differ because analysts use different growth assumptions, margin forecasts, discount rates, peer groups, terminal values, and risk adjustments. That is why valuation is better read as a range or scenario analysis.
How should beginners use a stock analysis report example?
Beginners should use the example as a structure for learning. The goal is to understand what each section is trying to test before relying on any final opinion or valuation estimate.