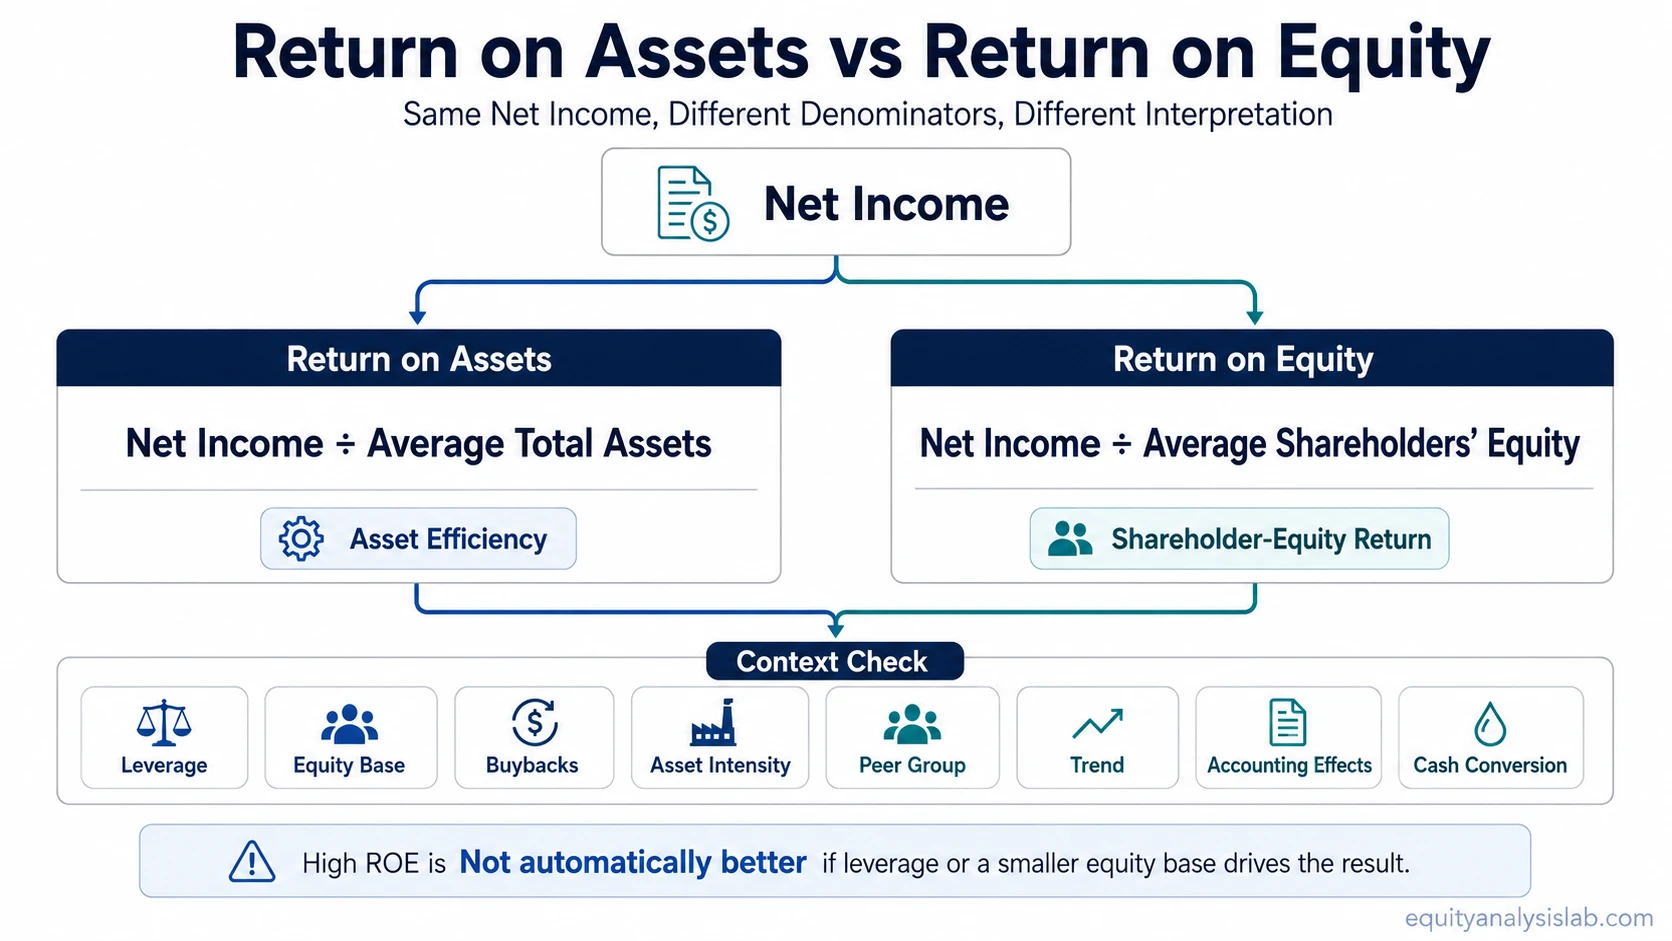
Return on assets compares net income with the asset base used to produce it. Return on equity compares net income with shareholder equity. The same company can therefore show a modest ROA and a much higher ROE when leverage, buybacks, or a smaller equity base amplify the equity denominator.
The useful distinction is not which ratio is “better.” ROA is usually the cleaner lens for asset efficiency. ROE is usually the closer lens for shareholder-equity return. Both can be useful, but they answer different questions and can diverge sharply when the balance sheet is financed with a meaningful amount of debt.
Key Points
- ROA compares net income with average total assets, so it focuses on how efficiently the company uses its asset base.
- ROE compares net income with average shareholders’ equity, so it focuses on the return produced on the accounting equity base.
- Leverage can make ROE look stronger than ROA because debt increases assets while equity remains smaller.
- Peer context matters because asset-heavy and asset-light businesses can produce very different ROA profiles.
- High ROE is not automatically superior if the result is driven by debt, buybacks, or a shrinking equity base.
What Is the Difference Between Return on Assets and Return on Equity?
Return on assets measures how much net income a company produces relative to the total asset base used in the business. It is useful when the investor wants to evaluate whether assets are being converted into earnings efficiently.
Return on equity measures how much net income a company produces relative to shareholders’ equity. It is useful when the investor wants to evaluate the return generated on the equity capital left in the business after liabilities are considered.
The two ratios often begin with the same numerator, net income, but they use different denominators. That denominator choice changes the interpretation. A company with a large asset base can have a lower ROA even if it earns meaningful profits. A company with a smaller equity base can show a higher ROE even when the underlying income is the same.
Return on Assets vs Return on Equity Formula
The formulas show why the two ratios can produce different readings from the same income statement result.
| Metric | Formula | Denominator logic |
|---|---|---|
| Return on assets | Net income / Average total assets | Compares profit with the total asset base used to operate the business. |
| Return on equity | Net income / Average shareholders’ equity | Compares profit with the accounting equity base attributable to shareholders. |
The formula difference matters most when assets and equity are far apart. Debt financing, accumulated losses, buybacks, write-downs, and accounting classifications can all change the relationship between total assets and shareholders’ equity.
Side-by-Side Comparison
| Comparison point | Return on assets | Return on equity |
|---|---|---|
| Main question answered | How efficiently does the company turn assets into net income? | How much net income is produced relative to shareholders’ equity? |
| Typical denominator | Average total assets | Average shareholders’ equity |
| What it emphasizes | Asset productivity and total-resource efficiency | Equity-base return and capital structure effects |
| Best use | Comparing companies where asset intensity is central to the business model | Reviewing returns to common shareholders within a capital allocation context |
| Common distortion | Can look lower for asset-heavy businesses even when the business is healthy | Can look unusually high when equity is reduced by leverage, buybacks, or losses |
| Peer context | Most useful among businesses with similar asset requirements | Most useful when leverage, equity base, and accounting structure are compared carefully |
Same-Company Example: Why ROA and ROE Can Diverge
Consider a hypothetical company with the following simplified figures:
| Input | Amount |
|---|---|
| Net income | $100 million |
| Average total assets | $1 billion |
| Average shareholders’ equity | $400 million |
| Metric | Calculation | Result |
|---|---|---|
| ROA | $100 million / $1 billion | 10% |
| ROE | $100 million / $400 million | 25% |
The company did not earn different income in each calculation. The percentage changed because the denominator changed. ROA compares the same profit with the full asset base. ROE compares the same profit with the smaller shareholder-equity base.
A 25% ROE may look much stronger than a 10% ROA, but the gap should trigger a balance-sheet check. The analyst would want to review leverage, equity reductions, buybacks, asset turnover, and cash conversion before deciding what the higher ROE actually means.
When ROA Is More Useful
ROA is more useful when the central question is asset efficiency. It helps compare how much profit a company produces from the assets required to run the business.
This matters for asset-heavy businesses, inventory-intensive businesses, lenders, manufacturers, retailers, transport companies, and any business where the asset base is central to operating performance. A low ROA is not automatically weak if the business model requires large assets, but it should be compared with similar companies and prior periods.
ROA can also help separate operating improvement from capital structure effects. If ROA improves, the company may be producing more income from the same asset base or using assets more efficiently. If ROA weakens, the issue may involve margins, asset turnover, asset sales, restructuring, accounting changes, or a temporary income effect.
When ROE Is More Useful
ROE becomes the better lens when the analysis is focused on the return produced on the shareholder equity base. It shows how much net income is produced relative to the accounting equity base that remains after liabilities are subtracted from assets.
This can help in capital allocation analysis because equity can be affected by retained earnings, dividends, buybacks, losses, and balance-sheet financing choices. A company that reinvests earnings effectively may produce a durable ROE profile, while another company may show high ROE mainly because the equity denominator has become unusually small.
ROE therefore needs a balance-sheet check. Debt can magnify ROE by allowing the company to operate with more assets than equity alone would support. Buybacks can also reduce equity and raise ROE mechanically. Those effects are not automatically negative, but they mean ROE should not be read without leverage, cash flow, and equity-base context.
Common Confusion: High ROE Is Not Automatically Better
A common mistake is treating ROE as the superior ratio because it often produces a higher percentage than ROA. That comparison can be false. ROE often looks higher because shareholders’ equity is usually smaller than total assets.
High ROE can reflect a strong business, but it can also reflect leverage, aggressive buybacks, a reduced equity base, or accounting effects. A high ROE paired with weak ROA may require a closer look at debt, asset productivity, interest burden, and whether earnings convert into cash.
ROA has its own limitation. It can make asset-heavy companies look less efficient than asset-light companies even when the asset-heavy business is performing well relative to its own industry. The safer reading is to compare both ratios against similar companies, prior periods, and the company’s financing structure.
ROA vs ROE and Leverage
Leverage is one of the main reasons ROA and ROE separate. When a company uses debt, assets can be much larger than equity. ROA sees the larger asset base. ROE sees the smaller equity base. That can make ROE rise faster than ROA even when net income does not change much.
This is why the gap between ROA and ROE is often more informative than either ratio alone. A wide gap can point to leverage, a small equity base, or a balance-sheet structure that needs review. It does not automatically mean the company is risky, but it does mean the investor should avoid reading ROE in isolation.
The wider the gap between ROE and ROA, the more important it becomes to check leverage, equity-base changes, buybacks, asset turnover, and cash conversion before treating the higher ROE as a quality signal.
ROIC Boundary Note
Return on invested capital can be useful when the analysis needs to focus on operating returns relative to the capital invested in the business. That is a different question from ROA and ROE.
ROA compares profit with total assets. ROE compares profit with shareholders’ equity. ROIC is often used when the analysis needs to separate operating performance from financing structure more carefully. It can be a useful related metric, but it should not replace the ROA vs ROE distinction.
How to Interpret Both Ratios Together
ROA and ROE are most useful when they are read against each other. ROA asks whether the asset base is productive. ROE asks whether the equity base is earning an attractive accounting return. A company with steady ROA and rising ROE may be benefiting from leverage or buybacks. A company with improving ROA and stable ROE may be improving asset efficiency without changing capital structure as much.
The practical boundary is simple: use ROA for asset efficiency, use ROE for shareholder-equity return, and check both against peer group, trend, asset intensity, leverage, accounting quality, and cash conversion before drawing conclusions.
FAQ
Is return on equity better than return on assets?
Return on equity is not automatically better than return on assets. ROE focuses on return relative to shareholders’ equity, while ROA focuses on return relative to total assets. The better metric depends on the question being asked.
Why is ROE often higher than ROA?
ROE is often higher because shareholders’ equity is usually smaller than total assets. Debt, buybacks, accumulated losses, and other balance-sheet effects can reduce the equity denominator and raise ROE relative to ROA.
Can a company have strong ROE and weak ROA?
Yes. A company can show strong ROE and weaker ROA when it uses meaningful leverage or has a small equity base. That does not automatically prove poor quality, but it does require a closer look at debt, cash flow, and peer context.
Should ROA and ROE be compared across all industries?
No. ROA and ROE should usually be compared within relevant peer groups. Asset-heavy and asset-light businesses can have very different normal ratio ranges, so cross-industry comparisons can be misleading.