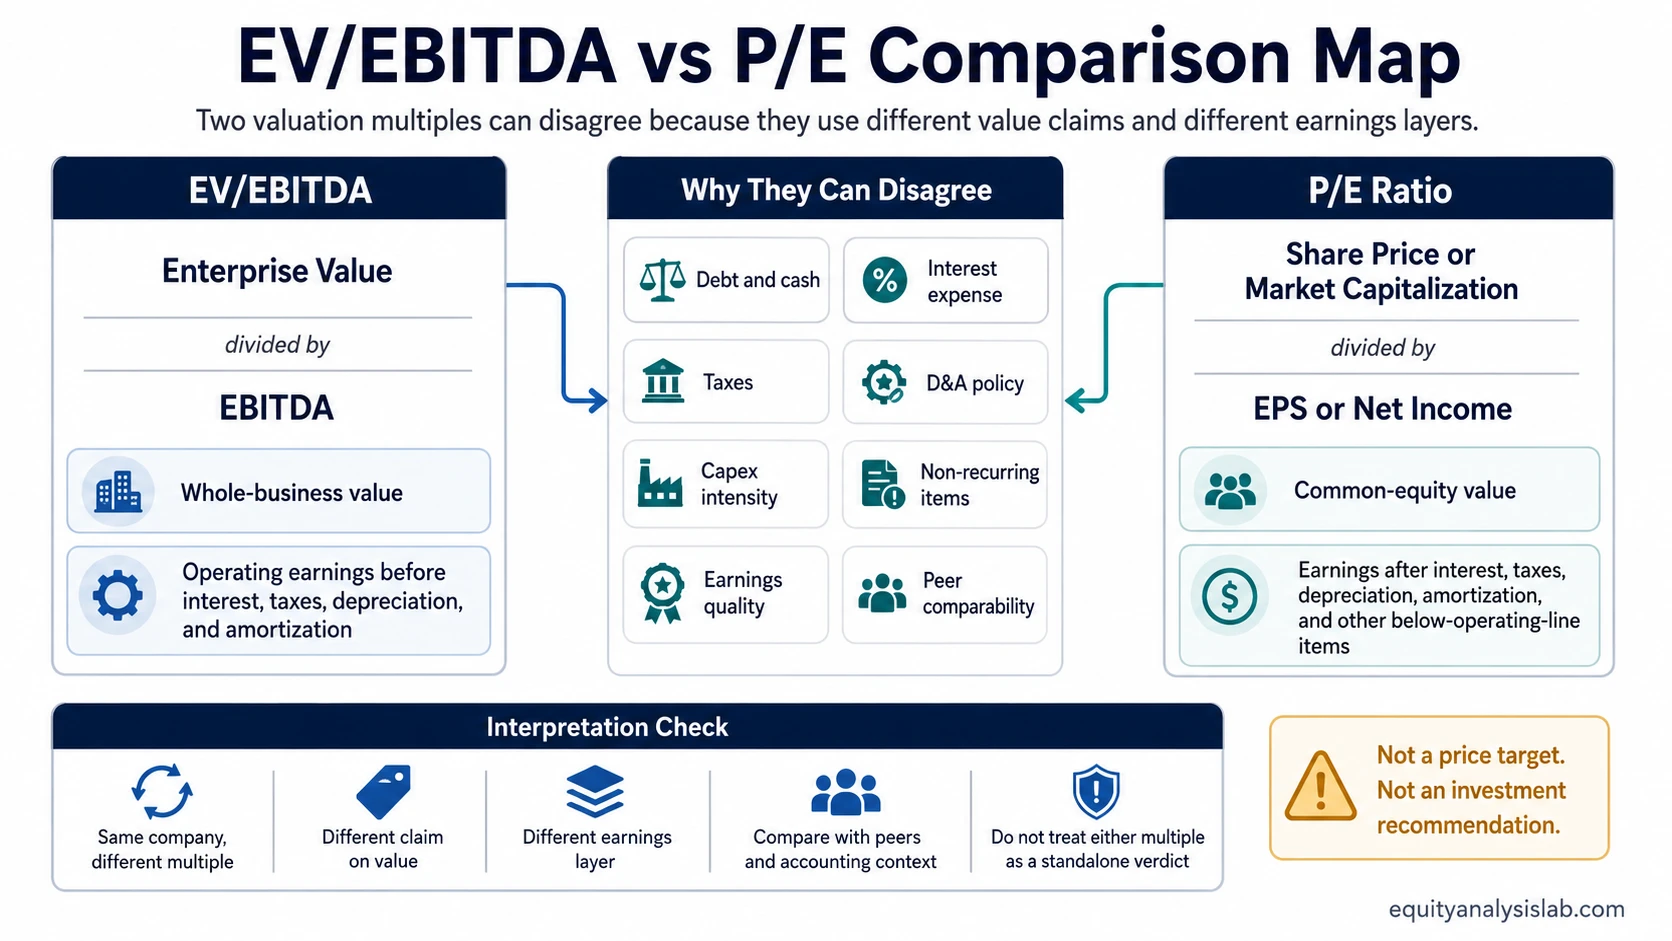
EV/EBITDA and P/E are both valuation multiples, but they answer different investor questions. EV/EBITDA compares the value of the whole business with operating earnings before interest, taxes, depreciation, and amortization. The price-to-earnings ratio compares the equity price with earnings available to shareholders.
The difference matters most when leverage, cash, depreciation, taxes, capital spending, or one-time earnings items change the relationship between operating earnings and net income. A company can look inexpensive on one multiple and less attractive on the other without either number being automatically wrong.
EV/EBITDA vs P/E: the quick difference
- EV/EBITDA is a business-level multiple because enterprise value includes debt and subtracts cash.
- P/E is an equity-level multiple because it focuses on share price or market capitalization relative to net income or EPS.
- EV/EBITDA reduces the direct effect of capital structure, interest expense, tax rate, and depreciation policy.
- P/E captures the earnings that remain for common shareholders after interest, taxes, depreciation, amortization, and other below-operating-line items.
- Neither metric proves fair value by itself. Each multiple needs peer context, earnings quality, balance-sheet context, and business-model interpretation.
Formula comparison
The formulas show why the two multiples can lead to different conclusions. They use different numerators, different earnings measures, and different claims on the business.
| Multiple | Formula | What it compares |
|---|---|---|
| EV/EBITDA | Enterprise value ÷ EBITDA | The value of the whole business relative to operating earnings before interest, taxes, depreciation, and amortization. |
| P/E | Share price ÷ EPS, or market capitalization ÷ net income | The value of common equity relative to earnings available to common shareholders. |
EV/EBITDA vs P/E comparison table
The cleanest way to compare EV/EBITDA and P/E is to separate the valuation question, the claim being valued, and the earnings measure being used.
| Criterion | EV/EBITDA | P/E |
|---|---|---|
| Main question | What does the whole business cost relative to operating earnings? | What does the equity cost relative to earnings per share? |
| Numerator | Enterprise value | Share price or market capitalization |
| Denominator | EBITDA | EPS or net income |
| Debt treatment | Debt is included in enterprise value, while interest expense is excluded from EBITDA. | Interest expense reduces net income, and debt can increase equity risk. |
| Cash treatment | Cash is usually subtracted from enterprise value. | Cash affects P/E indirectly through earnings, market price, or balance-sheet interpretation. |
| Depreciation and amortization | Excluded from EBITDA. | Included through net income. |
| Tax sensitivity | Lower because EBITDA is before tax. | Higher because net income is after tax. |
| Best use | Operating comparison across companies with different leverage or tax profiles. | Equity-holder earnings comparison for companies with stable, meaningful earnings. |
| Failure mode | Can overstate economics where capital expenditure and depreciation represent real recurring costs. | Can mislead when earnings are distorted, cyclical, non-recurring, or leverage-driven. |
Same-company example: why the metrics can disagree
Consider two hypothetical companies with similar operating earnings. Company A has heavy debt, high interest expense, and large depreciation charges. Company B has less debt, lower interest expense, and lighter depreciation. On an EV/EBITDA basis, the companies may look similar because both are compared against operating earnings before financing and depreciation.
P/E can tell a different story. Company A’s interest expense and depreciation reduce net income, so its P/E may look higher even if its EV/EBITDA appears reasonable. Company B may show a lower P/E because more operating profit reaches common shareholders. The disagreement does not mean one multiple is useless. It means the investor is looking at different layers of the same business.
Why EV/EBITDA and P/E can conflict
EV/EBITDA and P/E conflict when operating earnings and shareholder earnings separate. That separation often comes from debt, cash, interest expense, tax rate, depreciation, amortization, capital intensity, non-recurring items, or share count.
A low EV/EBITDA multiple can reflect attractive operating value, but it can also hide heavy reinvestment needs, weak cash conversion, or EBITDA that does not translate into net income. A low P/E multiple can reflect cheap equity earnings, but it can also reflect cyclical peak earnings, temporary tax benefits, unusual gains, or market concern about future earnings durability.
The practical question is not which multiple wins. The practical question is which claim on the business is being compared and whether the denominator is a reliable measure of recurring economics.
When EV/EBITDA is more useful
EV/EBITDA fits business-level operating comparisons before financing choices and tax structures. It is especially useful when peer companies have different leverage, different cash balances, or different interest expense profiles.
The metric also helps when the operating business is the main comparison unit. Peer companies with similar business models but different capital structures may be easier to compare with an enterprise-value multiple than with a pure equity multiple.
EV/EBITDA becomes weaker when EBITDA is a poor proxy for economic earnings. Capital-intensive companies, businesses with large maintenance capex, companies with aggressive add-backs, and firms with recurring restructuring costs can look cleaner on EBITDA than they are in cash terms.
When P/E is more useful
P/E fits equity-holder earnings comparisons. It works best when earnings are positive, reasonably stable, and not dominated by one-time gains or losses.
The metric can be more direct for mature companies with consistent profitability, modest accounting noise, and capital structures that do not distort the comparison. It also connects naturally to EPS, dilution, buybacks, and shareholder-level earnings power.
P/E becomes weaker when net income is temporarily depressed, temporarily inflated, highly cyclical, or shaped by unusual tax, interest, or non-operating items. A company with negative earnings or very small earnings can also produce a P/E ratio that is not meaningful.
The common mistake: treating lower as automatically cheaper
A lower EV/EBITDA does not automatically mean a stock is cheaper than another stock with a higher P/E. EV/EBITDA and P/E are built from different claims, different earnings measures, and different assumptions.
Before comparing the numbers, check whether the peer set, leverage, tax rate, depreciation, capex needs, non-recurring items, accounting treatment, and share count are comparable. A multiple is only useful when the denominator represents the economics the investor thinks it represents.
Limitations before using either multiple
- Capital intensity: EV/EBITDA can look too generous when depreciation and maintenance capex are economically necessary.
- Leverage: P/E can look worse when interest expense is high, while EV/EBITDA may still show the business before financing costs.
- Taxes: P/E is more affected by tax rates, tax assets, and one-time tax effects.
- Non-recurring items: Both metrics can mislead if EBITDA, net income, or EPS include unusual gains, losses, add-backs, or restructuring items.
- Cyclicality: A low multiple based on peak earnings can be a warning rather than a bargain.
- Peer quality: A multiple comparison is weak if the peer group differs materially in growth, margins, leverage, capital intensity, accounting policy, or business risk.
How to choose between EV/EBITDA and P/E
Use EV/EBITDA when the main question is business-level operating comparison. Use P/E when the main question is equity-holder earnings comparison. When the two multiples disagree, investigate the bridge between EBITDA and net income.
If EV/EBITDA looks low but P/E looks high, look for interest expense, depreciation, taxes, reinvestment needs, weak cash conversion, or add-backs that prevent operating earnings from reaching common shareholders. If P/E looks low but EV/EBITDA looks high, check whether equity earnings are being lifted by temporary gains, unusual tax effects, balance-sheet structure, or non-recurring items.
FAQ
Is EV/EBITDA better than P/E?
No. EV/EBITDA is better for some operating comparisons, while P/E is better for some equity-holder earnings comparisons. The better metric depends on the company, sector, capital structure, earnings quality, and purpose of the comparison.
Why can a company look cheap on EV/EBITDA but expensive on P/E?
That can happen when operating earnings are strong but interest expense, depreciation, taxes, non-operating costs, or share-count effects reduce net income. EV/EBITDA looks before many of those items, while P/E looks after them.
Should investors use both EV/EBITDA and P/E?
Often, yes. Using both can show whether the operating business and the shareholder earnings picture tell the same story. If the multiples disagree, the cause of the disagreement may be more useful than either headline number alone.