PE vs PEG is the difference between reading a company through a basic earnings multiple and reading that multiple after adding expected earnings growth. P/E shows how much investors pay for each unit of earnings. PEG starts with P/E, then asks whether that price looks different once growth expectations are included.
The two ratios are related, but they are not interchangeable. A P/E ratio can look high because investors are paying a large price for current earnings. A PEG ratio can make the same company look less stretched if expected earnings growth is strong and credible. The risk is that PEG adds another assumption, so it can clarify the valuation picture or make it look cleaner than the evidence supports.
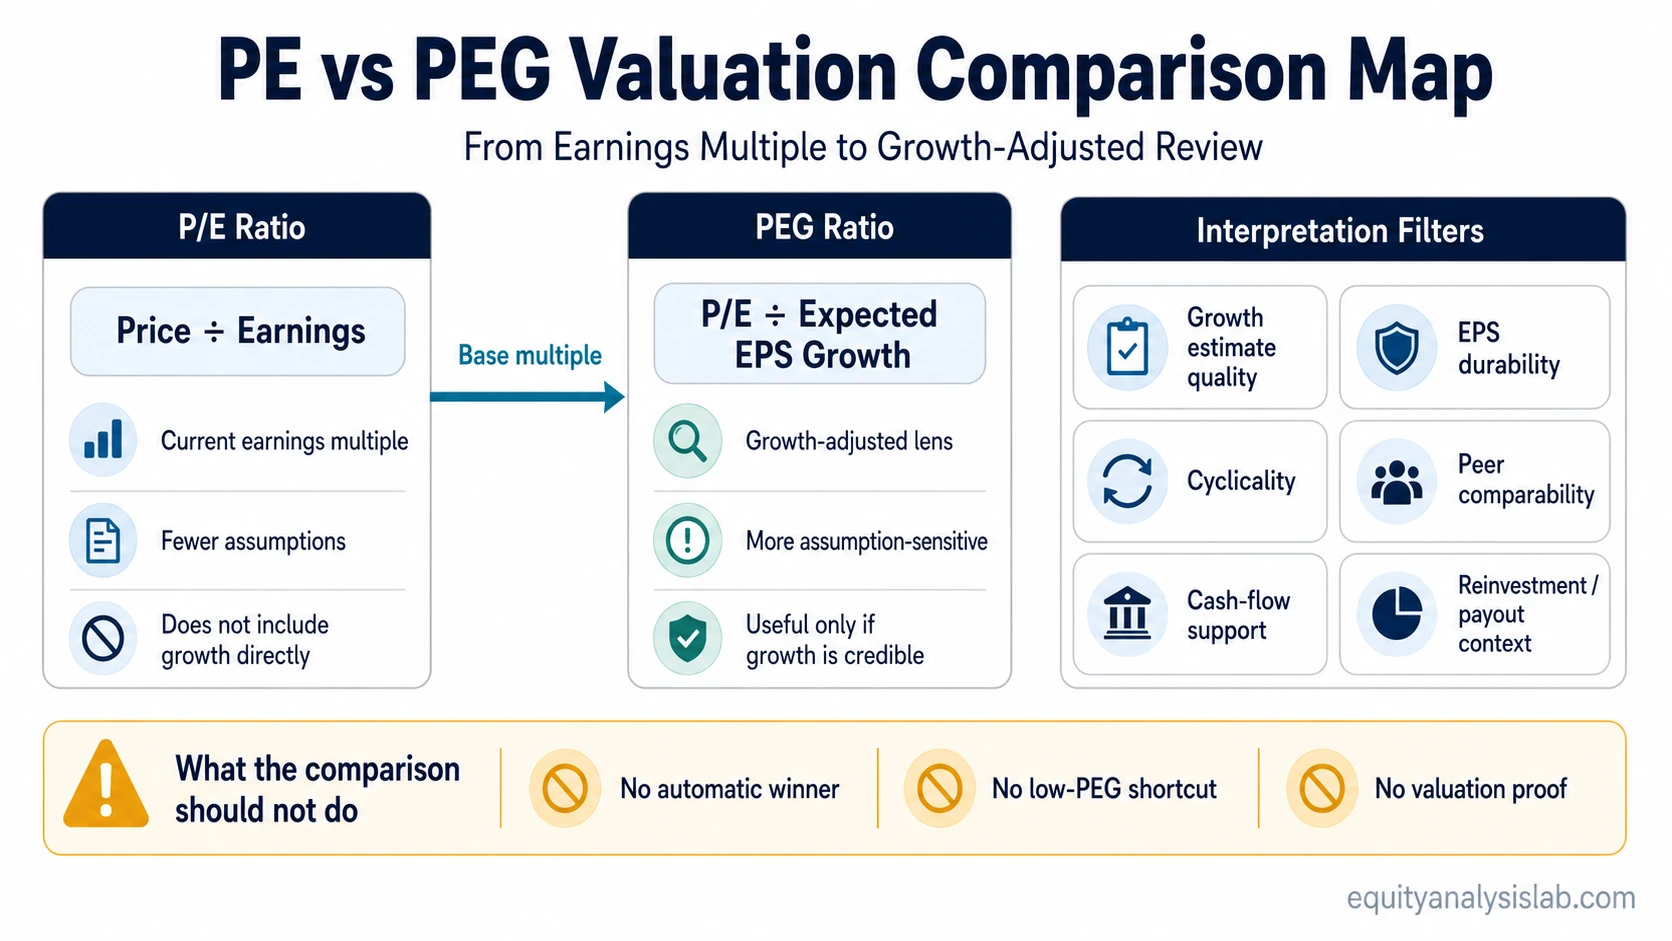
Core distinction: P/E compares price with earnings. PEG compares P/E with expected earnings growth. That makes PEG more context-sensitive, not automatically more reliable.
What PE and PEG compare
The price-to-earnings ratio compares a company’s share price with its earnings per share. It answers a simple valuation question: how much is the market paying for the company’s current or expected earnings base?
The PEG ratio adds expected earnings growth to that reading. It asks whether a company’s P/E looks high, low, or more moderate after the growth rate is considered.
That extra growth input is the main difference. P/E can be more direct because it uses fewer assumptions. PEG can be more informative when the growth estimate is reasonable, but it becomes weaker when that estimate is unstable, cyclical, or disconnected from earnings quality and cash-flow support.
PE vs PEG comparison table
| Ratio | Question it answers | Formula basis | What it can clarify | Where it weakens | Best deeper route |
|---|---|---|---|---|---|
| P/E | How much is the market paying for each unit of earnings? | Share price divided by earnings per share, or market value compared with earnings. | It gives a direct earnings-multiple reading and is easier to compare across similar companies. | It does not show whether future earnings growth justifies the multiple. | Use the full P/E method when the main question is the current earnings multiple. |
| PEG | How does the P/E look after expected earnings growth is included? | P/E ratio divided by an expected earnings growth rate. | It can add useful context when companies have different growth profiles. | It depends heavily on the growth estimate, EPS quality, cyclicality, and comparability. | Use the full PEG method when the main question is growth-adjusted valuation. |
The comparison is most useful when the companies being reviewed have similar accounting quality, similar business models, and comparable earnings cycles. If one company has durable recurring earnings and another has highly cyclical earnings, a simple PE vs PEG comparison can become misleading.
Same data, different valuation reading
Assume a company trades at 30 times earnings. On P/E alone, that looks more expensive than a company trading at 15 times earnings. The first company requires more current earnings power to support the same price level.
Now add expected EPS growth. If the 30 P/E company is expected to grow earnings by 30 percent and the 15 P/E company is expected to grow earnings by 5 percent, the PEG comparison changes the question. The higher P/E company may look less stretched on a growth-adjusted basis because the expected earnings base is expanding faster.
Example reading: A high P/E does not automatically mean a company is too expensive, and a lower PEG does not prove that the valuation is attractive. The growth estimate must still be tested against earnings quality, reinvestment needs, margin durability, and competitive position.
Why PEG is more assumption-sensitive
PEG can be useful because it forces the investor to ask whether a high or low earnings multiple makes sense relative to growth. The tradeoff is that the answer depends on the growth figure used in the denominator.
If the growth estimate is too optimistic, PEG can make an expensive company look more reasonable than it really is. If the estimate is too conservative, PEG can make a durable compounder look less attractive than its long-term earnings path may justify. This is why PEG should be treated as a growth-adjusted review tool, not as a final valuation answer.
Main limitation: PEG does not improve a valuation review if the growth estimate is weak. It only moves the analysis from “price versus earnings” to “price versus earnings and expected growth.” The quality of that expected growth still matters.
When P/E may be more useful
P/E may be more useful when the company has a mature earnings base, lower growth variation, or a business model where current earnings are a reasonable starting point. It is also cleaner when the investor wants a quick earnings-multiple comparison across companies with similar growth profiles.
P/E becomes weaker when earnings are temporarily depressed, unusually elevated, or heavily affected by one-time items. In those cases, the ratio may be mathematically simple but economically incomplete.
When PEG may be more useful
PEG may be more useful when two companies have different growth profiles and a plain P/E comparison would penalize the faster-growing company too quickly. It can also help when the investor wants to test whether a premium multiple has some connection to expected earnings expansion.
PEG becomes weaker when expected growth is speculative, when earnings quality is poor, or when future EPS depends heavily on assumptions that may not convert into cash flow. A low PEG is not enough if the company’s growth is fragile, cyclical, debt-supported, or dilution-heavy.
Common PE vs PEG mistake
The most common mistake is treating the comparison as a ranking system. A lower P/E is not automatically better. A lower PEG is not automatically better. Both ratios are shortcuts that need context.
A company with a higher P/E may deserve a higher multiple if it has durable margins, high reinvestment returns, strong cash conversion, and resilient earnings growth. A company with a low PEG may still be risky if growth expectations are unstable or if the earnings base is low quality.
What to check before trusting PEG
| Check | Why it matters |
|---|---|
| Growth estimate quality | PEG changes meaning when growth forecasts are aggressive, stale, or based on a temporary earnings rebound. |
| EPS durability | Expected EPS growth is more useful when earnings are repeatable and supported by the business model. |
| Cyclicality | Cyclical earnings can make both P/E and PEG look misleading near peaks or troughs. |
| Peer comparability | PEG comparisons are cleaner when companies have similar accounting, margins, capital needs, and business economics. |
| Cash-flow support | EPS growth is stronger when it is backed by cash flow rather than only accounting earnings. |
| Reinvestment and payout context | Growth is easier to interpret when the company can reinvest effectively or return capital without weakening future earnings quality. |
The safest use is to treat both ratios as starting points. P/E gives the base earnings multiple. PEG tests whether growth changes the interpretation. Neither ratio replaces a review of earnings durability, balance-sheet risk, reinvestment needs, and business quality.
How to use the full PE and PEG methods
Use P/E when the first question is how much the market is paying for earnings. Use PEG when the next question is whether expected growth changes that earnings-multiple reading. The distinction is useful because it keeps the investor from treating a high P/E as automatically negative or a low PEG as automatically positive.
For calculation details, earnings-input choices, and standalone interpretation limits, use the dedicated P/E and PEG methods after the comparison is clear.
FAQ
Is PEG always better than P/E?
No. PEG adds expected growth to the P/E reading, but that makes the result more dependent on forecast quality. P/E is simpler, while PEG is more assumption-sensitive.
Why can a high P/E stock have a lower PEG?
A high P/E stock can have a lower PEG if expected earnings growth is also high. That does not prove the valuation is attractive; it means the growth input changes how the P/E is interpreted.
When does PEG become unreliable?
PEG becomes less reliable when growth estimates are unstable, earnings quality is weak, profits are cyclical, or the companies being compared are not economically similar.