Earnings yield is a valuation ratio that divides earnings per share by share price and expresses the result as a percentage. It is the inverse of the P/E ratio, but it should be read as an earnings-to-price relationship, not as proof that a stock is cheap, safe, or attractive.
The metric is most useful when the earnings number is clean enough to compare against price. A high earnings yield can reflect a lower market price relative to earnings, but it can also reflect temporary profit strength, cyclical peak earnings, accounting noise, or future earnings risk that the market is already pricing in.
Key Points
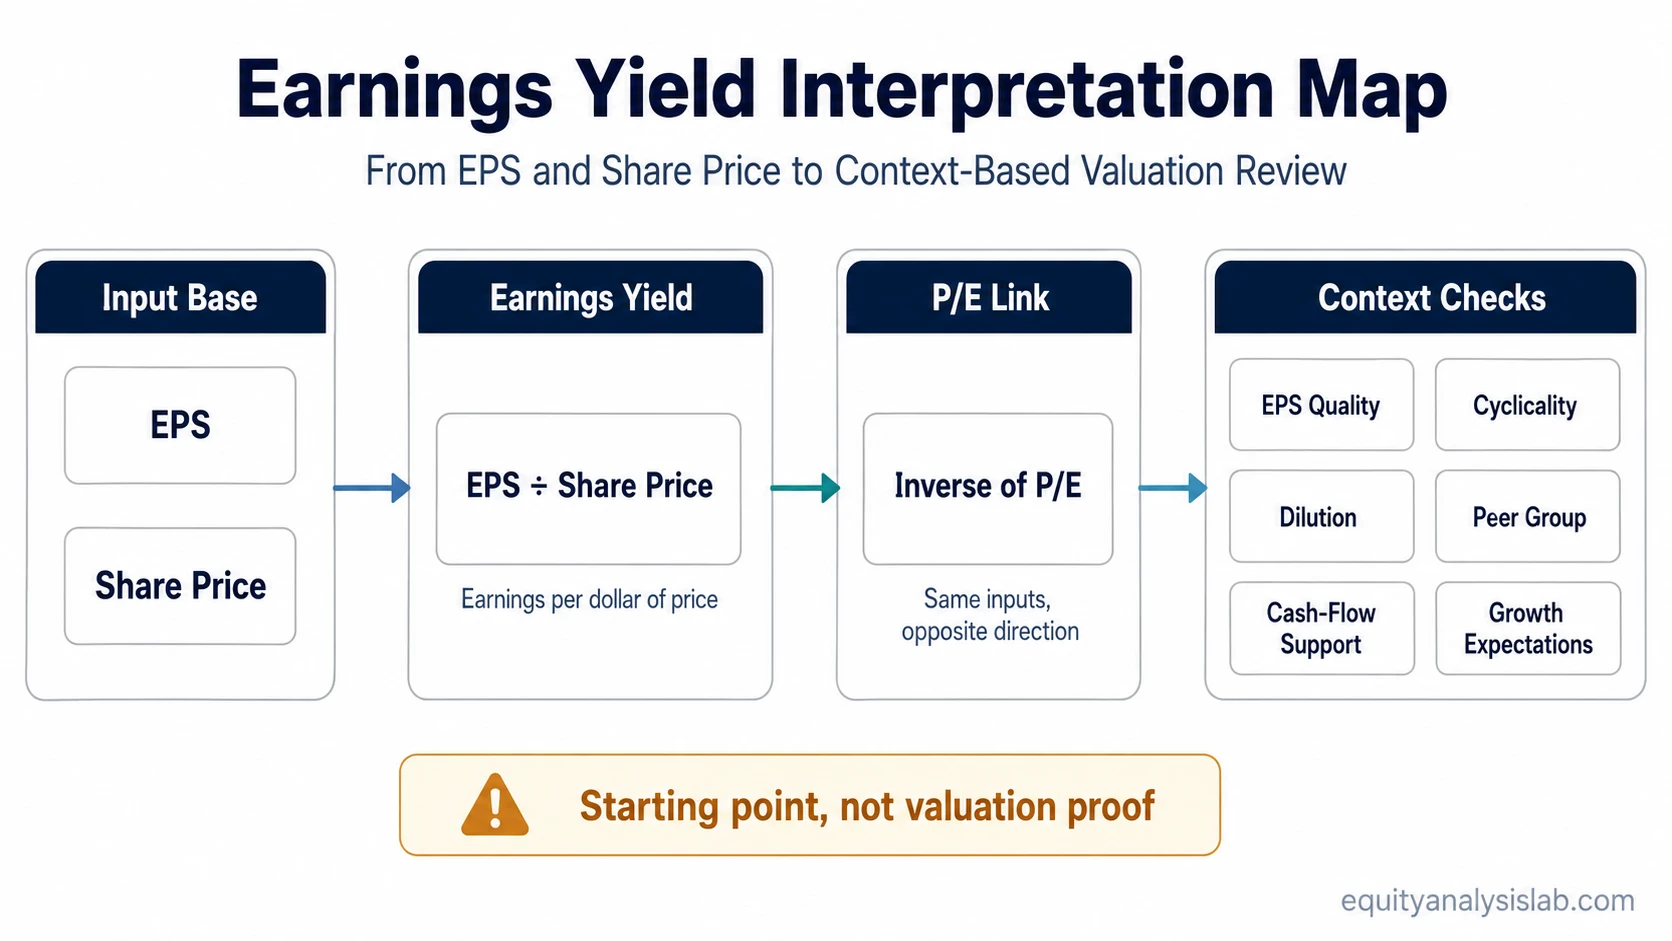
- Earnings yield equals earnings per share divided by share price.
- It is the inverse of the P/E ratio, so the same inputs are shown from the opposite direction.
- The ratio can help compare earnings output relative to price, especially across similar companies.
- Interpretation depends on EPS quality, cyclicality, dilution, one-time items, and growth expectations.
What Is Earnings Yield?
Definition: Earnings yield measures how much accounting earnings a company generates for each dollar of share price. It is usually calculated with earnings per share divided by the current share price, then shown as a percentage.
Earnings yield translates a price-to-earnings relationship into yield form. Instead of asking how many dollars investors pay for one dollar of earnings, it asks how many cents of earnings sit behind each dollar of market price.
That framing makes the metric easy to compare with other yield-style valuation readings, but the comparison is only as reliable as the earnings input. If EPS is inflated by one-time gains, temporarily high margins, aggressive accounting, or a cyclical profit peak, the earnings yield can look stronger than the underlying business economics support.
Earnings Yield Formula
The standard earnings yield formula is:
Earnings Yield = Earnings Per Share ÷ Share Price
When the result is shown as a percentage, multiply the decimal output by 100. A company with $5 of EPS and a $100 share price has an earnings yield of 5%.
Because earnings yield is the inverse of the P/E ratio, it can also be written as:
Earnings Yield = 1 ÷ P/E Ratio
The EPS input should be identified before the number is interpreted. Trailing EPS, forward EPS, and normalized EPS can produce different readings. A trailing figure may reflect the last reported period, a forward figure depends on estimates, and a normalized figure attempts to smooth unusual or cyclical earnings conditions.
Simple Earnings Yield Example
Illustrative example: If a company reports EPS of $5 and its share price is $100, the earnings yield is 5%.
Calculation: $5 ÷ $100 = 0.05, or 5%.
This means the company generated $5 of earnings for each $100 of share price before considering whether those earnings are durable, cash-supported, repeatable, or affected by temporary conditions.
The example shows the arithmetic, not an investment conclusion. The same 5% earnings yield can carry different meaning for a stable business, a cyclical company near peak margins, a company with heavy dilution, or a business where accounting earnings are not converting into cash flow.
How to Interpret Earnings Yield
A higher earnings yield means that reported earnings are larger relative to the current share price. A lower earnings yield means reported earnings are smaller relative to the current share price. Neither reading is complete without context.
Start with the earnings base. If EPS is supported by recurring operations and reasonable accounting quality, the ratio may give a clearer valuation reference. If EPS is distorted by non-recurring items, temporary margins, or cyclical timing, the ratio can overstate the earnings support behind the market price.
Then check the comparison group. Earnings yield is more useful when compared across similar companies, similar accounting models, and similar business cycles. Comparing a capital-light software company, a bank, a commodity producer, and a turnaround business through the same simple yield threshold can produce misleading conclusions.
Finally, ask what future earnings change the market may be pricing. A high earnings yield may reflect concern that earnings will fall, while a low earnings yield may reflect expectations for growth, durability, or unusually strong reinvestment economics. The ratio gives a starting point, not a finished valuation judgment.
Earnings Yield vs P/E Ratio
Earnings yield and the P/E ratio use the same core inputs, but they express the relationship in opposite ways. P/E shows how much price investors pay for each dollar of earnings. Earnings yield shows how much earnings are represented by each dollar of share price.
| Metric | Formula | What It Emphasizes | Main Interpretation Risk |
|---|---|---|---|
| P/E ratio | Share price ÷ EPS | Price paid for each dollar of earnings | Can look low when earnings are temporarily elevated |
| Earnings yield | EPS ÷ share price | Earnings represented by each dollar of price | Can look high when EPS is not durable or cash-supported |
A P/E ratio of 20 equals an earnings yield of 5%. The P/E format may be easier when thinking about valuation multiples. The earnings-yield format may be easier when comparing earnings output to other yield-style metrics. The underlying earnings assumptions remain the same in both cases.
Assumptions That Change the Earnings Yield Reading
The calculation is simple, but the interpretation is sensitive. The same reported earnings yield can become more useful or less useful depending on the quality of the earnings base, the source of EPS growth, and the reason the share price has moved.
| Assumption or Input | Why It Matters | Stronger Reading | Weaker Reading |
|---|---|---|---|
| EPS basis | Trailing, forward, and normalized EPS can produce different yields. | The EPS basis is stated clearly and matches the analysis purpose. | The metric mixes trailing price with unclear or aggressive earnings assumptions. |
| Earnings quality | Accounting earnings can differ from underlying business economics. | Earnings are recurring, operating-driven, and supported by cash generation. | Earnings rely on accounting adjustments, one-time gains, or weak cash conversion. |
| One-time items | Temporary gains or charges can distort EPS. | Unusual items are adjusted or clearly separated from recurring earnings. | A temporary EPS spike makes the yield appear unusually high. |
| Cyclicality | Some companies report peak earnings near the top of an industry cycle. | The yield is reviewed against normalized cycle earnings. | The yield is based on peak margins that may not persist. |
| Dilution | Future share issuance can reduce per-share earnings support. | Share count is stable or dilution is limited and understood. | EPS per share may weaken because ownership is being diluted. |
| Forward estimates | Forward earnings yield depends on analyst or model assumptions. | Estimates are reasonable and consistent with business conditions. | The yield depends on optimistic earnings growth that may not materialize. |
| Price movement | A falling share price mechanically raises earnings yield if EPS is unchanged. | The price decline is reviewed alongside fundamentals and risk changes. | A higher yield is caused mainly by market concern about future earnings. |
| Sector comparability | Different industries have different margin structures, capital needs, and accounting patterns. | The comparison is made within a relevant peer group. | The metric is compared across unrelated business models without adjustment. |
| Growth context | Low current earnings yield may reflect expected growth or reinvestment value. | Growth expectations are connected to credible earnings durability. | The ratio is judged without considering future earnings power or reinvestment needs. |
Limitations of Earnings Yield
Main limitation: Earnings yield is not proof of cheapness, safety, or future return. It is a compact valuation ratio that needs earnings-quality, business-cycle, and peer-context checks before it can support a valuation view.
Negative earnings can make the ratio unusable or misleading. If EPS is negative, the earnings yield no longer works as a clean positive valuation yield. In those cases, revenue, cash flow, balance-sheet risk, or normalized earnings may be more relevant depending on the company.
Cyclical companies can show high earnings yields near peak profits. That can happen when earnings are temporarily strong while the market is already discounting the possibility of lower future profits. Without a normalized earnings view, the ratio may make a cyclical company look cheaper than it really is.
Accounting earnings can also diverge from cash generation. A business may report positive EPS while free cash flow is weak because of working-capital demands, capital expenditure needs, or other cash drains. That is why earnings yield should not be treated as a substitute for cash-flow analysis.
Growth expectations can move the interpretation in the other direction. A low earnings yield may look expensive on current EPS, but the market may be pricing stronger future earnings durability or reinvestment economics. That does not make the valuation automatically justified; it means the earnings yield alone cannot settle the question.
Earnings Yield vs Other Yield-Based Valuation Metrics
Earnings yield focuses on accounting earnings relative to share price. If accounting earnings are less useful than cash generation for the company being reviewed, cash-flow yield may be the more relevant comparison because it shifts attention toward cash-flow output.
Free-cash-flow yield narrows the focus further by looking at cash remaining after reinvestment needs. That can matter when a company reports earnings but requires substantial capital spending or working-capital investment to maintain operations.
Bond-yield or dividend-yield comparisons should be kept conditional. Earnings yield is based on corporate earnings, not a contractual coupon or a declared dividend. It can be useful as a valuation reference, but it does not represent cash paid to shareholders and does not guarantee an investor return.
FAQ
What does earnings yield mean?
Earnings yield means earnings per share divided by share price, expressed as a percentage. It shows how much reported earnings sit behind each dollar of market price, but it does not prove that a stock is cheap or attractive.
How do you calculate earnings yield?
Divide EPS by share price, then multiply by 100 to express the result as a percentage. Earnings yield can also be calculated as 1 divided by the P/E ratio.
Is a higher earnings yield always better?
No. A higher earnings yield can reflect a lower price relative to earnings, but it can also reflect weak growth expectations, cyclical peak earnings, one-time gains, poor earnings quality, or market concern about future results.
How is earnings yield different from P/E?
P/E shows price divided by earnings, while earnings yield shows earnings divided by price. They use the same inputs but express the valuation relationship in opposite directions.