Free cash flow yield is free cash flow divided by a value measure, usually shown as a percentage. It compares the cash a business generates after capital spending with the market value, equity value, or enterprise value being used in the calculation.
The ratio is useful only when the cash-flow base and the value denominator match. A trailing free cash flow yield, a forward free cash flow yield, and a normalized free cash flow yield can describe the same company differently because each version answers a different valuation question.
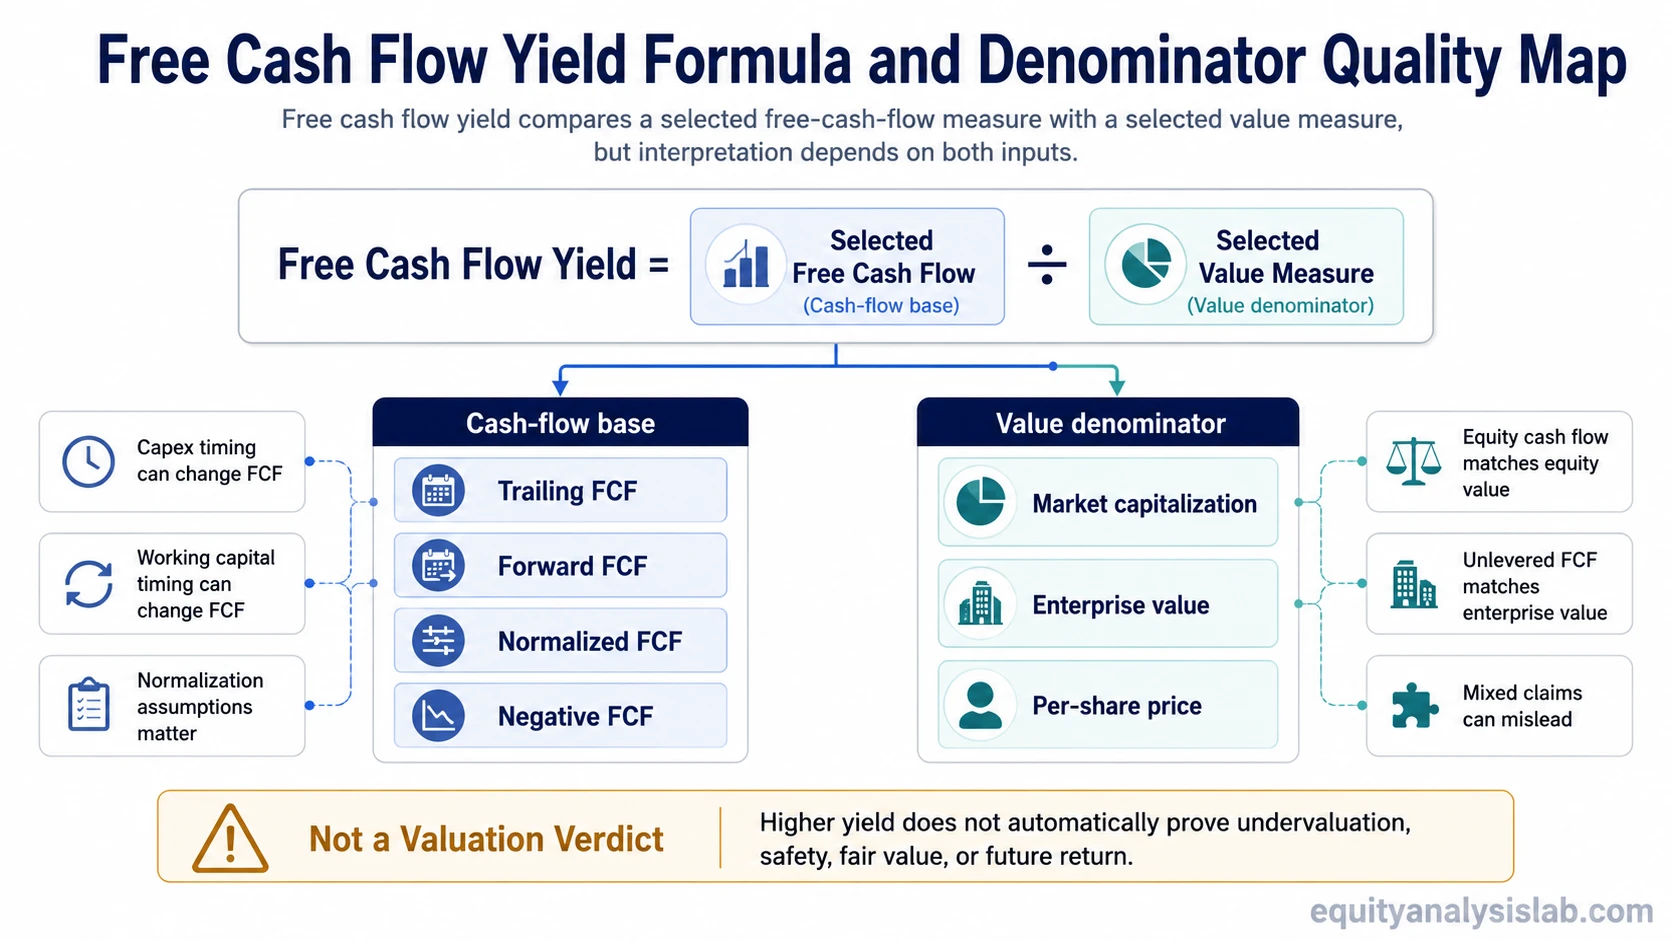
Definition: Free cash flow yield measures free cash flow as a percentage of a selected value measure.
Basic formula: Free cash flow yield = free cash flow / value measure.
Interpretation boundary: A higher free cash flow yield can indicate a lower price relative to current cash generation, but it does not prove undervaluation, safety, fair value, or future return by itself.
What Free Cash Flow Yield Means
Free cash flow yield is a yield-style valuation metric. Instead of asking how many dollars of value investors are paying for each dollar of earnings or sales, it asks how much free cash flow is produced relative to the value assigned to the business.
Free cash flow usually starts with cash generated from operations and subtracts capital expenditures. That makes the metric more cash-focused than earnings-based ratios, but it also makes the result sensitive to reinvestment cycles, working capital timing, and capital intensity.
The percentage matters only after the cash-flow number is tested for representativeness and matched with the correct value base.
Free Cash Flow Yield Formula
The general formula is:
| Formula version | Calculation | What it compares |
|---|---|---|
| General free cash flow yield | Free cash flow / value measure | Cash generation relative to a selected valuation base |
| Equity free cash flow yield | Free cash flow to equity / market capitalization | Cash flow available to equity holders relative to equity market value |
| Per-share free cash flow yield | Free cash flow per share / share price | Per-share cash generation relative to the share price |
| Enterprise free cash flow yield | Unlevered free cash flow / enterprise value | Operating cash flow generation relative to the value of the whole firm |
The formula becomes more meaningful when the numerator and denominator describe the same claim. Equity cash flow should be compared with equity value. Unlevered cash flow should be compared with enterprise value. Mixing these bases can create a yield that looks precise but answers the wrong question.
Which Value Measure Should Be Used?
The value measure controls the interpretation of free cash flow yield. Market capitalization focuses on the equity value of the company. Share price and free cash flow per share express the same idea at the per-share level. Enterprise value includes the value of both equity and net debt, so it is usually paired with unlevered free cash flow.
A market-cap version fits questions about cash flow available to common shareholders. An enterprise-value version fits questions about cash generation from the operating business before financing structure. Those are related questions, but they are not interchangeable.
The distinction matters most when companies have materially different debt levels, cash balances, lease obligations, capital structures, or interest costs. Two companies can show similar free cash flow yields on a market-cap basis while looking different on an enterprise-value basis.
Why the Free Cash Flow Base Matters
The numerator can change the ratio as much as the value measure does. Trailing free cash flow uses recently reported cash flow. Forward free cash flow uses an estimate. Normalized free cash flow attempts to smooth unusual working capital movements, cyclical swings, or unusually high or low capital expenditures.
A single-year free cash flow number can be distorted by inventory build, customer collection timing, supplier payment timing, restructuring cash costs, unusually low maintenance spending, or a temporary capex spike. None of those automatically makes the ratio useless, but each one changes what the percentage means.
Negative free cash flow also needs context. It can reflect distress, weak operations, heavy reinvestment, acquisition integration, cyclical pressure, or temporary cash-flow timing. The ratio should not be read as a clean valuation shortcut until the source of the negative cash flow is understood.
Free Cash Flow Yield Interpretation Table
Free cash flow yield becomes more reliable when the input choices are visible. The table below separates the major interpretation levers.
| Input choice | What changes | Interpretation risk |
|---|---|---|
| Trailing free cash flow | Uses recent reported cash flow | Can overstate or understate yield if the period included unusual working capital or capex timing |
| Forward free cash flow | Uses expected future cash flow | Depends on forecast quality and may change quickly if assumptions change |
| Normalized free cash flow | Smooths unusually high or low cash-flow periods | Can improve comparability, but the normalization assumptions must be clear |
| Market capitalization denominator | Compares cash flow with equity value | Can ignore debt and excess cash if the numerator is not equity-matched |
| Enterprise value denominator | Compares operating cash flow with whole-firm value | Requires a cash-flow measure that is consistent with enterprise value |
| Negative free cash flow | Turns the yield negative or not meaningful as a simple valuation signal | Requires separate analysis of reinvestment, distress, cyclicality, or timing |
Example Calculation
Assume a hypothetical company has a market capitalization of $1 billion. If it produces $80 million of free cash flow, its free cash flow yield is 8%.
Calculation: $80 million / $1 billion = 8%.
If the same company produces only $40 million of free cash flow during a year with unusually high capital expenditures, the free cash flow yield falls to 4% using the same market capitalization.
Calculation: $40 million / $1 billion = 4%.
The lower yield in the second version does not automatically mean the business became less valuable. It may mean the cash-flow base changed because of investment timing. The next analytical step is to decide whether the lower free cash flow is temporary, structural, or part of a normal reinvestment cycle.
Common Mistakes When Reading Free Cash Flow Yield
Treating high yield as automatic undervaluation: A high free cash flow yield may reflect an attractive valuation, but it may also reflect cyclicality, declining cash flow expectations, balance-sheet risk, or a market discount for business quality.
Ignoring the capex cycle: Free cash flow can rise when capital expenditures are temporarily low. That can make the yield look stronger even if future reinvestment needs are higher.
Mixing cash-flow and value claims: Levered free cash flow and enterprise value should not be combined casually. The numerator and denominator need to describe the same economic claim.
Comparing unlike businesses mechanically: Companies with different capital intensity, working capital needs, cyclicality, growth reinvestment, or debt structure may deserve different free cash flow yield interpretation.
Free Cash Flow Yield vs Related Yield Metrics
Free cash flow yield is narrower than cash flow yield because it focuses on cash remaining after capital expenditures, rather than any cash-flow measure selected for analysis.
It also differs from earnings yield, which compares earnings with price or value. Earnings yield can fit cases where accounting profit is representative, while free cash flow yield focuses more directly on cash generation after reinvestment spending.
The choice between these metrics depends on the analytical question. If the issue is accounting profitability, an earnings-based yield may be more relevant. If the issue is cash generation after capital spending, free cash flow yield may fit better.
Limits of Free Cash Flow Yield
Free cash flow yield is an assumption-sensitive comparison tool, not a valuation verdict. A high free cash flow yield does not prove that a stock is undervalued, fairly valued, safe, or likely to produce a future return.
A low or negative free cash flow yield does not automatically prove overvaluation either. It can reflect heavy reinvestment, early-stage growth, acquisition integration, cyclicality, temporary working capital pressure, or business weakness. Those conditions require different interpretations.
The metric is strongest when it is used with cash-flow quality, balance-sheet context, capital intensity, growth durability, and peer comparability. It is weakest when it is used as a standalone screen without checking how the numerator and denominator were built.
FAQ
Is free cash flow yield the same as earnings yield?
No. Free cash flow yield uses free cash flow as the numerator, while earnings yield uses earnings. The two metrics can differ when accounting earnings and cash generation move differently.
Is a higher free cash flow yield always better?
No. A higher yield can suggest a lower valuation relative to free cash flow, but it can also reflect business risk, cyclical pressure, falling expectations, or temporarily elevated cash flow.
Can free cash flow yield be negative?
Yes. Free cash flow yield can be negative when free cash flow is negative. The reason matters because negative free cash flow can come from reinvestment, timing, cyclicality, or operating weakness.
Should free cash flow yield use market cap or enterprise value?
It depends on the cash-flow measure. Equity free cash flow is usually compared with market capitalization, while unlevered free cash flow is usually compared with enterprise value.