Pricing power can be measured by checking whether a company can raise prices while preserving demand, retention, market share, and margin resilience. The strongest evidence combines margin stability, price-volume mix, customer behavior, competitor response, and management language from filings or earnings calls. No single metric proves pricing power on its own.
The measurement task is narrower than defining pricing power as a business-quality concept. The goal is to test whether pricing strength appears in observable behavior, not merely in a management claim or one strong margin line.
Key Points
- Durable pricing power is easier to trust when margins hold while volume, retention, and market share remain resilient.
- Price increases are weaker evidence when they come with falling demand, rising churn, or share loss.
- Industry-wide inflation, cost cuts, supply shortages, and commodity cycles can make pricing evidence look stronger than it is.
- Management commentary can help identify the claim, but financial statements and customer behavior must test it.
How to Measure Pricing Power
Pricing power is inferred from a sequence of evidence. A company raises prices, customers respond, competitors react, and the financial statements show whether margins absorb the change or deteriorate. The signal becomes stronger when price increases do not materially damage volume, renewals, market share, or gross margin quality.
A narrow measurement framework should separate three questions: did the company raise price, did customers accept the increase, and did economics improve without relying only on temporary cost cuts or supply constraints?
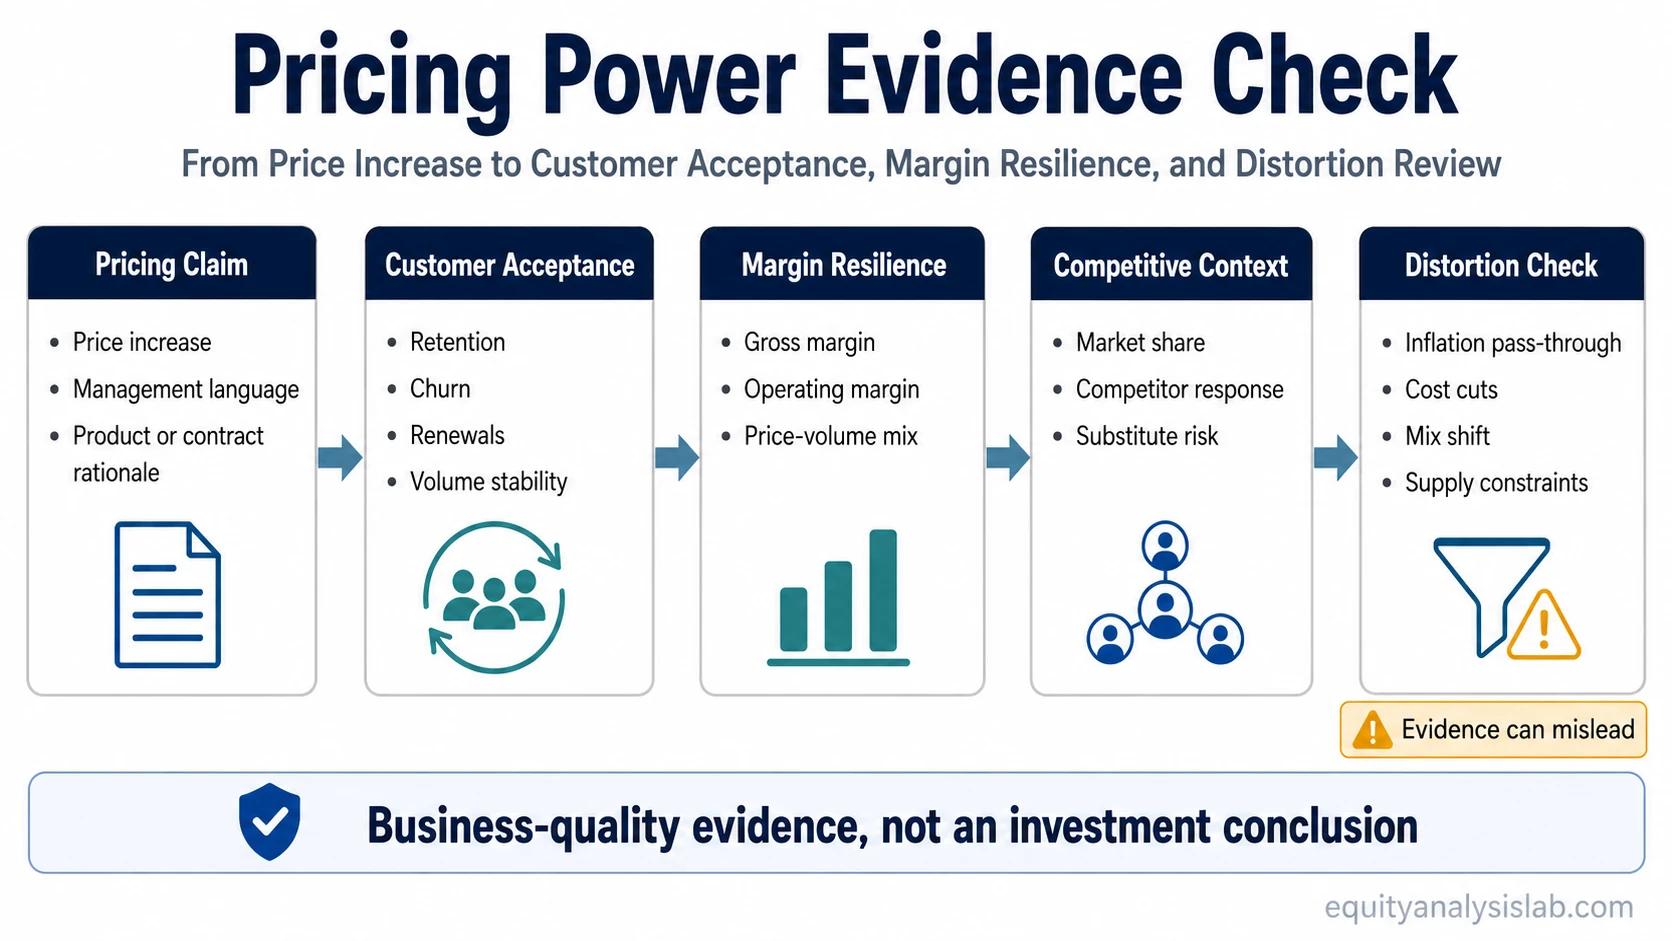
Measurement sequence: price change → customer behavior → margin resilience → competitor response → distortion check.
Interpretation boundary: the sequence helps evaluate business quality and durability. It does not predict returns, prove that a stock is attractive, or replace valuation work.
The Evidence That Matters Most
The best pricing power evidence is not one metric. It is a pattern across financial statements, customer behavior, competitive data, and management commentary. Each evidence type carries a different interpretation risk, so the useful reading comes from comparing the signal with the distortion that could explain it.
| Evidence to check | What it can indicate | Where to find it | What can distort it |
|---|---|---|---|
| Gross margin stability | Prices may be offsetting cost pressure without major demand loss. | Income statement, segment disclosures, management discussion. | Mix shift, accounting changes, temporary input-cost relief, product upgrades. |
| Operating margin resilience | Pricing may be flowing through after selling, marketing, and operating costs. | Income statement, segment operating income, margin bridge commentary. | Cost cuts, hiring freezes, restructuring, lower growth investment. |
| Price-volume mix | Price increases may be accepted if volume does not fall materially. | Revenue bridge, segment reports, earnings call commentary. | Volume decline hidden by acquisitions, currency, mix, or short-term backlog. |
| Retention, churn, or renewal behavior | Customers may tolerate higher prices when renewal rates stay strong. | SaaS metrics, subscription disclosures, customer cohorts, contract renewal data. | Long contracts, delayed churn, switching frictions, short observation windows. |
| Market share after price increases | The company may have firm-specific pricing power if share remains stable. | Industry data, company filings, third-party market data, segment commentary. | Weak competitors, temporary supply shortages, category growth masking share loss. |
| Competitor response | Pricing may be durable if competitors cannot easily undercut the company. | Competitor filings, industry commentary, pricing announcements. | Industry-wide price increases that do not prove company-specific strength. |
| Contract structure or switching costs | Customers may be less likely to leave after price increases. | Contract disclosures, customer concentration notes, renewal terms. | Contracts that delay churn rather than prevent it. |
| Customer concentration | Large customers may limit pricing leverage even when margins look stable. | Revenue concentration disclosures, major customer notes, segment reports. | A few customers may renegotiate terms or demand concessions later. |
| Transcript or filing language | Management may identify where price increases were attempted and why. | 10-K, 10-Q, annual report, investor presentation, earnings call transcript. | Narrative can overstate durability if not confirmed by customer and margin behavior. |
Margin Stability Is Evidence, Not Proof
Stable gross margin after price increases can be a useful early signal. It suggests that price may be offsetting cost pressure or improving economics without immediate demand collapse. The reading becomes stronger when operating margin also holds after normal selling, administrative, and reinvestment costs.
A cleaner reading compares gross margin, operating margin, and price-volume mix together, because margin stability is less convincing if the price increase is accompanied by persistent volume weakness.
Margin evidence is weaker when the improvement comes mostly from cost reductions. A company can protect operating margin by cutting expenses, slowing hiring, reducing marketing, or delaying reinvestment. That may improve short-term profitability, but it does not prove customer willingness to pay higher prices.
Useful distinction: margin resilience supports the pricing-power case only when it appears alongside customer acceptance. Margin expansion by itself can reflect mix, cost control, supply conditions, or accounting changes.
Customer Behavior After Price Increases
Customer behavior is often the clearest test. If a company raises prices and still keeps retention, renewals, volume, or market share stable, the evidence becomes more meaningful. If volume falls sharply or churn rises after a price change, the company may have raised price but not proven durable pricing power.
For subscription businesses, renewal rates, net retention, churn, and contract expansion can help show whether customers accept higher prices. For product businesses, price-volume mix and market share can show whether customers continue buying after price changes.
Customer dependence also matters. A company may look strong in aggregate while a few large buyers still hold negotiating power. In that case, customer concentration risk can weaken the interpretation even when reported margins appear stable.
Competitor Response and Industry Context
Firm-specific pricing power is stronger when competitors cannot easily undercut the company or take share after price increases. If every company in the industry raises prices because input costs are rising, the evidence may show pass-through pressure rather than a durable company advantage.
Competitor response helps separate broad inflation from company-level strength. A company with real pricing power should show evidence that customers still prefer its product, service, distribution, brand, network, switching cost, or reliability even after the price change.
Segment evidence can matter more than company-wide averages. Pricing strength may appear in one product line, geography, customer group, or contract type while another segment remains highly competitive. Company-level margin stability can hide that variation.
Transcript and Filing Evidence
Filings and earnings-call transcripts can show what management says about price increases, demand, mix, cost inflation, contracts, and renewal behavior. This language helps identify the claim that needs testing.
It should not be treated as proof. Management may describe pricing actions before the full customer response appears in reported numbers. A cleaner reading compares the narrative with later revenue mix, margin behavior, churn, renewal data, and competitor response.
Common mistake: treating confident management language as the evidence itself. The better use is to treat the language as a hypothesis, then test whether the financial and customer data support it.
Where Pricing Power Evidence Can Mislead
- High margins alone do not prove pricing power.
- One price increase does not prove durable pricing power.
- Industry-wide inflation can make pricing appear stronger than it is.
- Cost cuts can improve margins without proving customer willingness to pay.
- Commodity cycles can distort pass-through evidence.
- Customer concentration can weaken pricing power even when margins look stable.
- Management narrative is evidence to test, not proof.
These limitations matter because pricing power is an inference, not a direct line item. The evidence becomes more useful when several indicators point in the same direction and the main distortions have been checked.
A Simple Measurement Scenario
A company raises prices by mid-single digits after input costs rise. In the next two reporting periods, gross margin stays stable, renewal rates remain close to prior levels, and management says volume pressure is limited. That is useful evidence, but it is not complete.
The reading becomes stronger if competitors do not take share and if the company is not relying mainly on temporary cost cuts. It becomes weaker if renewal timing delays churn, if large customers negotiate concessions, or if the whole industry is raising prices at the same time.
Pricing Power vs Price Elasticity
Price elasticity measures how sensitive demand is to a price change. Pricing power is the business-quality interpretation of that behavior. Low demand sensitivity can support the pricing-power case, but investors still need to check margins, competition, contract structure, and customer behavior before treating the evidence as durable.
This distinction keeps the analysis from becoming a pricing-strategy exercise. For investor research, the question is not only whether price can rise, but whether the company keeps enough demand and economics to support durable business quality.
How This Fits Into Business Quality Analysis
Measuring pricing power helps investors evaluate whether a company has durable economics or only temporary margin support. Stronger evidence can improve the business-quality reading, but it still has to be connected to reinvestment needs, competitive pressure, balance-sheet risk, and valuation.
Durable pricing power may influence how management can fund growth, protect margins, or return cash, but those choices belong to a broader capital allocation analysis. Pricing power evidence is one input in that process, not a final investment conclusion.
FAQ
What is the best way to measure pricing power?
The best way is to combine margin resilience, price-volume mix, retention or churn, market share, competitor response, and management commentary. No single metric is enough on its own.
Is high gross margin proof of pricing power?
No. High gross margin can support the analysis, but it can also reflect product mix, cost structure, accounting treatment, supply conditions, or temporary cost relief.
How do customer retention and churn help measure pricing power?
They show whether customers keep buying or renewing after price increases. Stable retention after higher prices is stronger evidence than a price increase alone.
Can pricing power predict stock returns?
No. Pricing power can help evaluate business quality and durability, but it does not predict returns, prove valuation upside, or create a stock recommendation.