
Customer concentration risk is the risk that a company depends heavily on one customer or a small group of customers for revenue. The concentration percentage identifies dependency, but the economic risk depends on the durability, profitability, bargaining power, payment behavior, and replaceability of that revenue.
A concentrated customer base can make revenue, margins, and cash flow more sensitive to a single contract decision. It can also arise from a specialized market, a long-term customer relationship, or an embedded product that is difficult to replace. The percentage is therefore the beginning of the analysis rather than the conclusion.
What Is Customer Concentration Risk?
Customer concentration risk exists when a meaningful share of a company’s revenue depends on one customer, several major customers, one distributor, one platform, one government buyer, or another narrow source of customer demand.
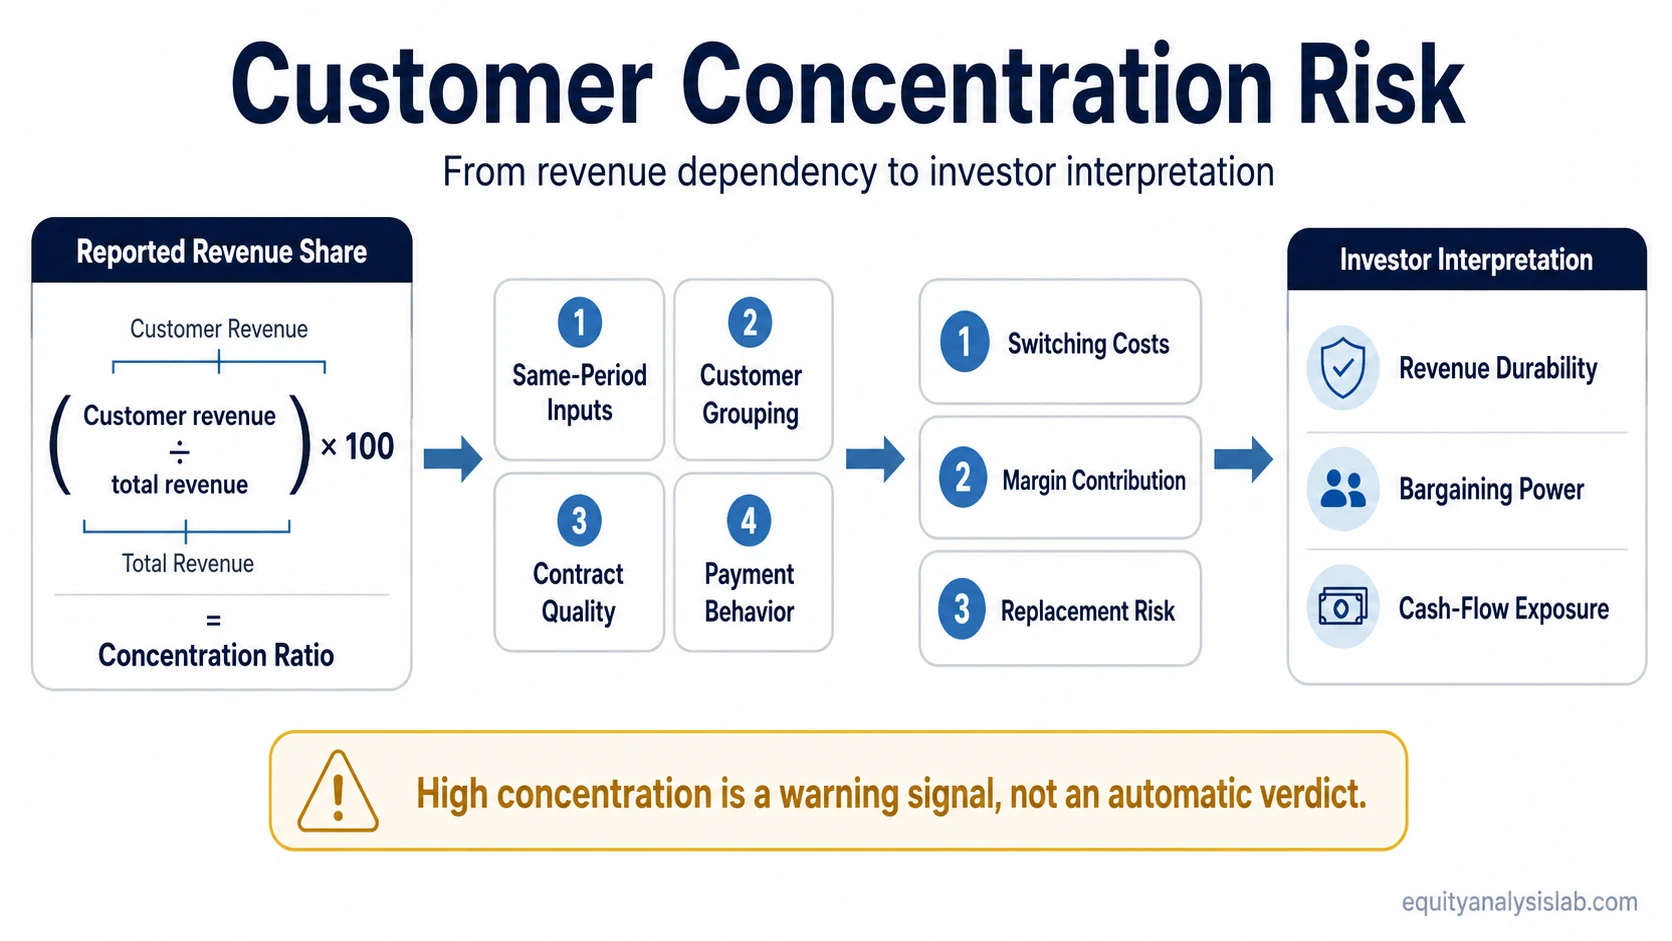
Concentration can appear in several forms. One customer may account for a large share of sales, the top few customers may dominate the revenue base, or a company may depend on one distributor or platform even when the underlying end users are more diversified.
How Customer Concentration Is Calculated
The basic calculation compares revenue associated with a selected customer or customer group with total company revenue for the same period.
| Measure | Formula | What Must Match |
|---|---|---|
| Single-customer concentration | Revenue from one customer ÷ total revenue × 100 | Customer revenue and total revenue should cover the same period. |
| Top-customer concentration | Revenue from selected top customers ÷ total revenue × 100 | The customer group should be defined consistently across periods. |
| Channel or platform concentration | Revenue through one channel ÷ total revenue × 100 | The channel definition should distinguish the intermediary from the underlying end customer when possible. |
Example:
Total annual revenue: $100 million
Revenue from largest customer: $18 million
Single-customer concentration = $18M ÷ $100M × 100 = 18%
If the company’s five largest customers collectively contribute $42 million, top-five concentration is 42%. That calculation describes how much revenue is concentrated, but it does not establish how risky those relationships are.
What the 10% Major-Customer Threshold Means
Under ASC 280 segment reporting, a U.S. public entity generally discloses when revenue from transactions with a single external customer amounts to 10% or more of the entity’s total revenue. The disclosure includes the fact that a major customer exists, the total revenue attributable to that customer, and the segment or segments reporting the revenue. The customer’s identity does not have to be disclosed.
The 10% threshold is a disclosure threshold, not an investment risk threshold. A customer representing 11% of revenue is not automatically dangerous, and a customer representing 9% is not automatically immaterial to the business.
Economic risk still depends on the relationship itself. Contract duration, renewal behavior, customer credit quality, switching costs, pricing leverage, margin contribution, and the availability of replacement revenue can matter more than whether the percentage happens to sit just above or below 10%.
There is also no universal top-five concentration percentage that separates a strong business from a weak one. Industry structure matters. A supplier serving a market with only a few large buyers may naturally have a more concentrated customer base than a consumer business serving millions of individual customers.
Check the Inputs Before Interpreting the Percentage
The formula is simple, but the customer definition and measurement basis can materially change the result.
| Input Check | Why It Matters | Possible Misread |
|---|---|---|
| One legal entity vs one economic customer group | Several entities under common control may represent one underlying customer relationship. | The company can appear more diversified than the economic exposure actually is. |
| Same measurement period | The numerator and denominator need to describe the same revenue period. | A stale denominator can overstate or understate concentration. |
| Recurring vs project revenue | A temporary project and a recurring customer relationship create different durability profiles. | One large project can make temporary concentration look permanent. |
| Direct customer vs distributor or platform | The invoiced customer may not be the ultimate source of demand. | Operational dependency can be misunderstood if the intermediary and end customer are treated as the same thing. |
| Annual, quarterly, or trailing-period basis | Seasonality and rapid growth can change customer shares substantially across measurement periods. | One quarter can make a temporary concentration spike look like a persistent structure. |
Revenue Concentration vs Accounts Receivable Concentration
Revenue concentration and accounts receivable concentration measure different exposures. They should not be treated as interchangeable.
| Measure | Main Question | Primary Risk Signal |
|---|---|---|
| Revenue concentration | How much of company sales depend on this customer? | Demand, renewal, contract, bargaining-power, and replacement risk. |
| Accounts receivable concentration | How much of outstanding customer collections depend on this customer? | Collection timing, credit exposure, and short-term cash-conversion risk. |
Consider a company where Customer A represents 18% of annual revenue but 35% of accounts receivable at year-end.
Customer A share of annual revenue: 18%
Customer A share of accounts receivable: 35%
The 18% revenue share shows meaningful dependence on the customer for sales. The 35% receivables share shows that an even larger portion of outstanding collections is tied to the same customer at the reporting date.
This does not prove that the customer has poor credit quality or will pay late. It identifies a second concentration that needs separate investigation. Payment terms, invoice timing, overdue balances, customer credit quality, and historical collection behavior become relevant.
Diagnostic distinction: revenue concentration measures dependence on a customer for business volume. Receivables concentration measures dependence on that customer for outstanding cash collection.
What Makes Customer Concentration More or Less Risky?
The same 18% customer concentration can represent very different economics depending on the underlying relationship.
| Factor | Higher-Risk Reading | Lower-Risk Reading |
|---|---|---|
| Contract structure | Short commitment, easy cancellation, uncertain renewal. | Longer commitment with a consistent renewal history. |
| Switching costs | The customer can replace the supplier with little disruption. | The product is embedded in systems, workflows, compliance, or operations. |
| Bargaining power | The customer can demand discounts or unfavorable contract terms. | The supplier provides differentiated value and retains negotiating flexibility. |
| Margin contribution | The large customer generates revenue but weak economics. | The relationship contributes attractive and sustainable margins. |
| Credit and collections | Payment delays or financial stress at the customer create cash-flow exposure. | Payment behavior is reliable and receivables remain controlled. |
| Replacement capacity | Losing the customer would leave capacity, inventory, or revenue that is difficult to replace. | Demand from other customers could absorb a meaningful part of the lost business. |
| Concentration trend | The largest customers are becoming a progressively larger share of the business. | Revenue is diversifying as the company grows. |
| Industry structure | Few buyers have structural negotiating power over suppliers. | Concentration reflects a specialized market but supplier economics remain attractive. |
Switching costs can materially change the interpretation. A concentrated customer relationship is generally more durable when the product is difficult to remove from the customer’s workflow. That is why concentration should be read alongside the company’s competitive advantage and customer stickiness.
Translate Customer Concentration Into Revenue at Risk
The concentration percentage can be converted into a simple downside scenario. This does not predict what will happen, but it shows how sensitive total company revenue is to a change in spending by a major customer.
Gross revenue shock = customer concentration × reduction in customer spending
Assume the largest customer represents 18% of company revenue and reduces purchases by 50%.
Customer concentration: 18%
Reduction in customer spending: 50%
Gross revenue shock = 18% × 50% = 9%
Before any replacement sales, the customer reduction would therefore remove revenue equal to 9% of the company’s original total revenue.
The next step is to estimate how much of that lost revenue could be replaced by other customers, new contracts, alternative channels, or unused demand.
Net revenue gap = customer concentration × spending reduction × (1 − replacement rate)
If the company can replace 40% of the lost revenue:
Customer concentration: 18%
Reduction in customer spending: 50%
Replacement rate: 40%
Net revenue gap = 18% × 50% × 60% = 5.4%
The same 18% concentration can therefore create very different outcomes depending on customer behavior and replacement capacity. A business with alternative demand may absorb part of the shock, while a company with specialized capacity or a narrow customer market may retain most of the revenue loss.
Revenue-at-risk interpretation: concentration measures the size of the dependency. The potential revenue shock depends on how much customer spending changes and how much of the lost business can be replaced.
How Customer Concentration Affects Business Quality
Customer concentration becomes a business-quality problem when dependence on a small number of buyers weakens revenue durability, pricing flexibility, margins, cash conversion, or the company’s ability to absorb a contract loss.
It can also change how other apparently positive metrics should be interpreted. Strong revenue growth is less diversified if most incremental sales come from one account. Stable recurring revenue is less reassuring if renewal power sits with a single large customer. High margins may be vulnerable if one buyer has enough negotiating leverage to reset pricing.
This makes customer concentration part of broader business model analysis. The investor needs to understand not only how revenue is generated, but how many independent customer relationships support it and how resilient those relationships are.
Management’s response can also matter. capital allocation decisions may broaden the product offering, expand distribution, enter new customer segments, or deepen the existing relationship. Those choices should be evaluated by whether they improve the economics of the business rather than by diversification alone.
A large customer can also restrict pricing flexibility when a major buyer has negotiating leverage. In that situation, the primary concentration risk may appear in margins and contract terms before it appears in reported revenue.
Customer Concentration Risk Example
Assume a company generates $100 million of annual revenue. Its largest customer contributes $18 million, representing 18% of total revenue.
Now compare two possible versions of that same relationship.
| Factor | Case A | Case B |
|---|---|---|
| Revenue concentration | 18% | 18% |
| Contract | Multi-year | Annual renewal |
| Switching cost | High | Low |
| Margin contribution | Strong | Thin |
| Payment behavior | Reliable | Frequently extended terms |
| Replacement capacity | Alternative demand exists | Revenue would be difficult to replace |
The concentration ratio is identical in both cases, but Case B exposes the company to a more fragile combination of renewal risk, bargaining power, margin pressure, collection risk, and replacement difficulty.
The calculation therefore does more than label the business as having 18% concentration. It identifies how much revenue is dependent on the relationship and which contract, margin, collection, and replacement assumptions need deeper analysis.
Where Investors Can Find Customer Concentration Disclosures
For public companies, customer concentration information may appear in several parts of the filing rather than in one standardized table.
| Filing Area | What to Look For |
|---|---|
| Segment and major-customer disclosures | Revenue attributable to customers that meet the company’s major-customer disclosure criteria. |
| Concentration-of-risk notes | Revenue, receivables, supplier, geographic, or credit concentrations. |
| Revenue and accounts receivable notes | Large customer balances, customer classifications, collection exposure, and related accounting details. |
| Risk factors | Dependence on material customers, contract renewals, procurement cycles, or customer bargaining power. |
| Management commentary | Changes in large contracts, customer losses, delayed orders, diversification efforts, or shifts in customer mix. |
The most useful review compares these disclosures across several reporting periods. A single concentration percentage shows the current exposure; the trend can show whether dependency is increasing, declining, or moving between customers.
FAQ
Does a customer representing more than 10% of revenue automatically create high investment risk?
No. The 10% level is relevant to major-customer disclosure under U.S. public-company segment reporting, but it is not a universal investment risk cutoff. Economic risk depends on contract durability, switching costs, bargaining power, margins, credit quality, and replacement capacity.
Why compare customer revenue concentration with accounts receivable concentration?
Revenue concentration measures dependence on the customer for sales, while accounts receivable concentration measures how much outstanding collection exposure is tied to that customer. A company can have moderate revenue concentration but much higher receivables concentration at a reporting date.
Can a company have high customer concentration and still be a strong business?
Yes. Concentration can coexist with strong business quality when the relationship is durable, profitable, difficult for the customer to replace, supported by reliable payment behavior, and not giving the customer excessive bargaining power. The concentration still remains an exposure that should be monitored.