Basic EPS is the earnings available to common shareholders divided by the weighted average common shares outstanding during the reporting period. It is one form of the earnings per share measure, and it helps investors read per-share profitability without including potential future dilution from options, convertibles, or similar instruments.
The number usually appears with EPS disclosures in the income statement and/or notes to the financial statements. It connects net income, preferred dividends, and the common share count into one per-share figure. The result can also change for reasons that are not the same as stronger business quality, including buybacks, accounting items, loss periods, and changes in share count.
Key Points
- Basic EPS measures earnings available to common shareholders on a weighted average common-share basis.
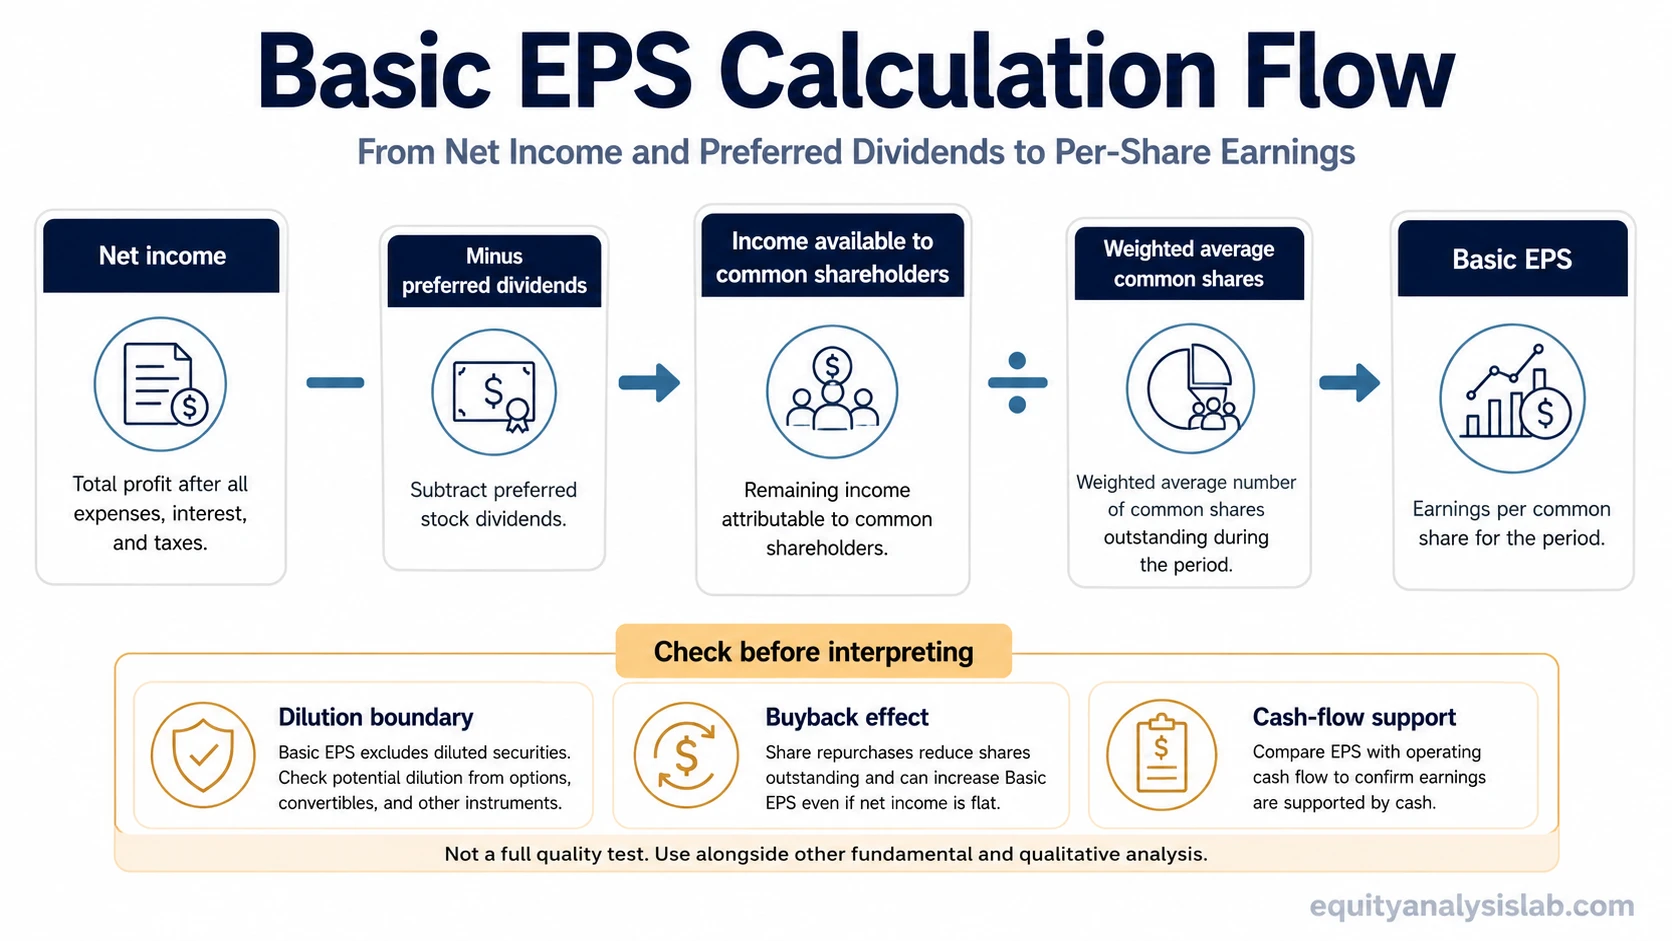
- The basic EPS formula is net income minus preferred dividends, divided by weighted average common shares outstanding.
- The denominator should match the reporting period, so share-count changes during the period matter.
- Basic EPS excludes potential common shares that may appear in diluted EPS.
- Higher basic EPS is not automatically stronger unless earnings quality, cash conversion, share-count movement, and valuation context also support the reading.
What Is Basic EPS?
Basic EPS, or basic earnings per share, shows how much of a company’s earnings are attributable to each weighted average common share. It starts with profit available to common shareholders, not simply the headline net income number, because preferred dividends must be removed when preferred stock exists.
The measure is “basic” because it uses common shares already outstanding during the period. It does not include possible future shares from convertible securities, options, warrants, or other instruments that could increase the share count later.
Basic EPS definition: Basic EPS is income available to common shareholders divided by weighted average common shares outstanding for the same reporting period.
Basic EPS Formula
The standard basic EPS formula is:
Basic EPS = (Net income − preferred dividends) ÷ weighted average common shares outstanding
| Formula element | Meaning |
|---|---|
| Net income | The company’s reported profit for the period. |
| Preferred dividends | Dividends owed to preferred shareholders before earnings are available to common shareholders. |
| Income available to common shareholders | Net income after subtracting preferred dividends, when preferred stock exists. |
| Weighted average common shares outstanding | The average common share count during the period, adjusted for timing of share issuance, repurchases, or other share-count changes. |
The numerator and denominator should refer to the same reporting period. If the income figure covers a full year, the weighted average share count should also represent that year, not only the ending share count on the balance sheet date.
How to Calculate Basic EPS
A simple calculation starts with income available to common shareholders and then divides that amount by the weighted average common share count.
Example: A company reports $120 million in net income, $5 million in preferred dividends, and 50 million weighted average common shares. Income available to common shareholders is $115 million. Basic EPS is $115 million divided by 50 million shares, or $2.30.
| Input | Amount | Role in calculation |
|---|---|---|
| Net income | $120 million | Starting profit figure |
| Preferred dividends | $5 million | Subtracted before common-share EPS |
| Income available to common shareholders | $115 million | Numerator |
| Weighted average common shares | 50 million | Denominator |
| Basic EPS | $2.30 | Per-share result |
This example is intentionally simple. Real filings may include multiple share classes, preferred stock terms, stock dividends, splits, repurchases, or other adjustments that affect the final EPS presentation.
Where Basic EPS Appears in Financial Statements
Basic EPS usually appears in the income statement or in the notes that explain earnings per share. Public companies commonly present basic EPS and diluted EPS together because the two numbers answer related but different questions.
The basic figure focuses on existing common shares. The diluted figure asks how EPS would look if potential common shares were included when they are dilutive. That is why investors usually read basic EPS alongside diluted EPS rather than treating it as the full EPS picture.
Basic EPS vs Diluted EPS
Basic EPS and diluted EPS both measure per-share earnings, but they use different share-count assumptions. Basic EPS uses weighted average common shares outstanding. Diluted EPS includes additional potential common shares when those instruments would reduce EPS or increase loss per share.
| Measure | Share-count basis | Main use |
|---|---|---|
| Basic EPS | Weighted average common shares already outstanding | Shows per-share earnings for existing common shares. |
| Diluted EPS | Weighted average common shares plus dilutive potential common shares | Shows the effect of possible future share issuance from dilutive instruments. |
A large gap between basic EPS and diluted EPS can signal that potential dilution matters. A small or absent gap does not remove the need to read the share-count notes, especially when options, convertibles, warrants, or restricted stock units are material.
How Investors Should Interpret Basic EPS
Basic EPS is useful because it puts earnings on a per-share basis. That makes it easier to compare one period with another and to connect accounting profit with shareholder ownership. Still, the number should not be treated as a complete investment conclusion.
One important check is whether the EPS change came from better earnings or from fewer shares. A company can report higher basic EPS because net income improved, because buybacks reduced the weighted average share count, or because both happened at the same time.
| Basic EPS driver | What to check | Why it matters |
|---|---|---|
| Higher net income | Revenue, margins, nonrecurring items, and tax effects | Shows whether earnings growth reflects operating improvement or accounting noise. |
| Lower share count | Repurchases, issuance, dilution, and treasury stock movement | Shows whether per-share growth came partly from capital allocation rather than business growth. |
| Stronger reported EPS | Cash conversion and earnings quality | Shows whether the reported earnings are supported by cash flow. |
Basic EPS becomes more informative when it is connected to cash flow, share dilution, valuation, and EPS growth over multiple periods.
Limits of Basic EPS
Basic EPS has several limits. It can simplify complex capital structures, and it may look stronger even when the underlying business has not improved. It can also be affected by accounting gains, restructuring charges, tax items, or other nonrecurring effects.
- Dilution boundary: Basic EPS excludes potential common shares that diluted EPS may include.
- Buyback effect: Repurchases can raise per-share earnings even when total net income is flat.
- Preferred dividend adjustment: Preferred dividends reduce income available to common shareholders.
- Share-count timing: Issuances, repurchases, stock splits, and stock dividends can change the denominator.
- Loss periods: Negative basic EPS means the company reported a per-share loss for common shareholders. The result still depends on the same numerator and weighted average share-count mechanics.
- Valuation context: Higher basic EPS is not automatically attractive if expectations, business quality, or valuation already reflect the improvement.
A practical reading treats basic EPS as one evidence point. The number becomes more useful when it is checked against earnings quality, cash flow, durability, share-count movement, dilution risk, and valuation expectations.
Related Earnings Concepts
Basic EPS is the starting per-share earnings figure for existing common shares. Broader EPS analysis usually compares it with diluted EPS, reviews the full earnings per share presentation, and then studies whether per-share earnings are growing for reasons that are durable.
| Concept | Use it when the question is… |
|---|---|
| Diluted EPS | How would per-share earnings look if dilutive securities were included? |
| Earnings per share | How does EPS work as a broader financial reporting measure? |
| EPS growth | Is per-share earnings power improving or weakening across periods? |