EPS growth measures the percentage change in earnings per share from one period to another. It starts with the EPS line reported in the income statement, but the number only becomes useful after checking whether the increase came from stronger earnings, a lower share count, one-time accounting effects, or weak cash conversion.
What EPS Growth Means
EPS growth shows how much a company’s earnings per share increased or decreased between two comparable periods. It is a growth rate, not the EPS number itself.
If a company reports EPS of $2.00 in one year and $2.40 in the next year, the EPS level is $2.40 in the later year. The EPS growth rate is 20% because the per-share earnings increased by one-fifth from the starting period.
The useful distinction is simple: earnings per share is the per-share earnings amount, while EPS growth measures the change in that amount over time.
Key Points About EPS Growth
- EPS growth measures the percentage change in earnings per share between two periods.
- The calculation can use annual, quarterly, trailing twelve-month, or multi-year EPS, but the periods must be comparable.
- EPS growth can come from higher net income, a lower share count, or both.
- A higher EPS growth number needs support from earnings quality, cash flow, and share-count analysis before it carries much analytical weight.
- Diluted EPS growth is often more conservative when stock options, convertible securities, or other potential shares matter.
Where EPS Growth Comes From in the Statements
EPS growth begins with the EPS figure reported alongside the income statement. The calculation normally compares the EPS line from one period with the EPS line from another period.
The input can be basic EPS or diluted EPS, but the choice should stay consistent across the comparison. Comparing basic EPS in one period with diluted EPS in another period can distort the growth rate.
Period selection also matters. A year-over-year comparison may show a different picture than a quarter-over-quarter comparison. A trailing twelve-month comparison can smooth some seasonality, while a multi-year growth rate can reduce the influence of one unusually strong or weak year.
EPS Growth Formula
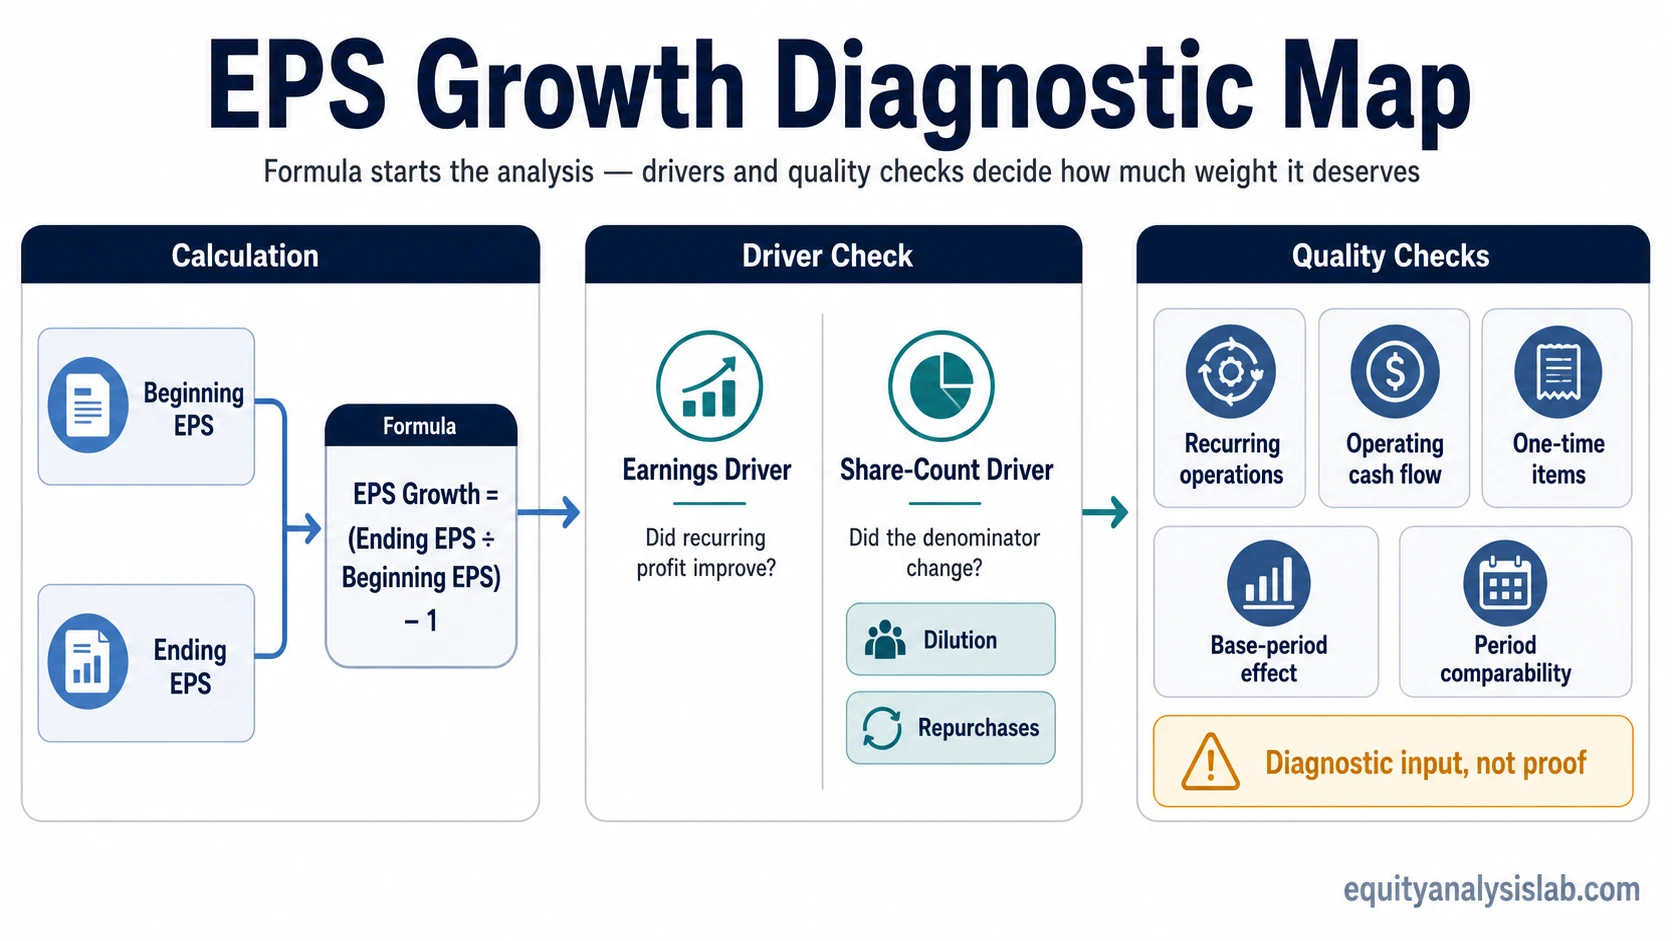
The one-period EPS growth formula is:
EPS Growth = (Ending EPS ÷ Beginning EPS) − 1
The same formula can also be written as:
EPS Growth = (Ending EPS − Beginning EPS) ÷ Beginning EPS
The ending EPS is the later-period EPS number. The beginning EPS is the earlier-period EPS number. The result is usually expressed as a percentage.
The formula is simple, but the interpretation depends on the drivers. EPS is a per-share metric, so growth can improve when total earnings rise, when the share count falls, or when both happen together. EPS growth can also weaken even when net income rises if dilution expands the denominator faster than earnings increase.
Simple EPS Growth Example
A company reports diluted EPS of $2.00 last year and $2.40 this year.
EPS Growth = ($2.40 ÷ $2.00) − 1 = 0.20, or 20%
That means diluted earnings per share increased by 20% from the prior year to the current year.
The interpretation depends on what produced the increase. If net income and operating cash flow also improved, the growth has stronger support. If net income was flat and EPS rose mainly because the company reduced its share count through buybacks, the same 20% figure needs a different reading.
Why Basic vs Diluted EPS Changes the Reading
EPS growth depends on the denominator as well as the earnings numerator. Basic EPS uses the weighted-average common shares outstanding. Diluted EPS includes the effect of potential shares when they are dilutive.
This difference matters because a company can show stronger basic EPS growth than diluted EPS growth when potential share issuance is meaningful. Stock options, convertible securities, restricted stock units, and similar instruments can expand the diluted share count and reduce the per-share growth rate.
Buybacks can work in the opposite direction. If a company reduces its share count, EPS may rise even when net income is only flat or modestly higher. That does not make the growth meaningless, but it changes what the number is saying. In that case, EPS growth may reflect capital allocation and share-count reduction more than underlying profit expansion.
What EPS Growth Can Hide
EPS growth can look strong while the underlying earnings picture is less durable. A single growth rate does not show whether the improvement came from repeatable operations, temporary accounting gains, tax effects, acquisitions, cost cuts, buybacks, or a weak starting period.
- One-time items: Asset sales, legal settlements, tax benefits, or unusual gains can lift EPS for one period without improving recurring earnings power.
- Accounting effects: Changes in estimates, non-cash items, or timing differences can affect reported earnings before they appear in cash flow.
- Buybacks: A lower share count can raise EPS even when total earnings are not growing at the same pace.
- Dilution: New shares or dilutive securities can reduce per-share growth even if net income improves.
- Base-period distortion: EPS growth can look unusually high when the starting period was depressed.
- Cash-flow mismatch: EPS growth deserves less weight when operating cash flow does not support the reported profit improvement.
EPS Growth Quality Checks
| Check | Question to Ask | Why It Matters |
|---|---|---|
| EPS line used | Is the comparison using the same EPS basis in both periods? | Mixing basic and diluted EPS can distort the growth rate. |
| Period selection | Are the periods comparable? | Quarterly, annual, TTM, and multi-year comparisons can tell different stories. |
| Share count | Did the share count fall or rise materially? | EPS growth can be helped by buybacks or reduced by dilution. |
| Net income quality | Did the earnings increase come from recurring operations? | One-time gains can make EPS growth look stronger than the core business. |
| Cash conversion | Did operating cash flow move with reported earnings? | EPS growth is stronger when profit growth is supported by cash generation. |
| Capital allocation | Were buybacks funded sustainably? | Buyback-driven EPS growth needs to be checked against free cash flow, leverage, and reinvestment needs. |
| Base-period effect | Was the starting EPS unusually low? | A recovery from a weak base can produce a high growth rate without proving durable momentum. |
Annual, Quarterly, TTM, and Multi-Year EPS Growth
EPS growth is clearer when the comparison period matches the question being asked. Annual EPS growth is often used to compare one fiscal year with the next. Quarterly EPS growth can show shorter-term changes, but it can also be noisy because of seasonality and timing effects.
Trailing twelve-month EPS growth can reduce some quarter-to-quarter noise by comparing rolling twelve-month periods. Multi-year EPS growth, often expressed as a compound annual growth rate, can help separate a one-year rebound from a more durable earnings trend.
A multi-year view still needs the same checks. A smooth EPS growth record is stronger when it is supported by recurring earnings, cash conversion, and a stable or explainable share-count path.
Common Mistakes When Reading EPS Growth
A common mistake is treating EPS growth as standalone proof of business quality. Positive EPS growth can be useful, but it is only one diagnostic signal.
Another mistake is assuming every EPS increase has the same meaning. A 20% EPS growth rate supported by higher revenue, better margins, and stronger operating cash flow is different from a 20% growth rate caused mainly by a lower share count or a temporary tax benefit.
It is also risky to compare EPS growth across companies without context. Sector cyclicality, capital intensity, accounting rules, buyback behavior, and margin structure can change what the same percentage growth rate means.
EPS Growth vs Related Concepts
Earnings per share is the base metric. EPS growth measures how that base metric changes over time.
Basic EPS focuses on earnings divided by the weighted-average common share count. Diluted EPS adjusts for potential shares when they reduce per-share earnings. EPS growth can be calculated from either figure, but diluted EPS growth can provide a more cautious view when dilution matters.
Quality of earnings is a broader reliability check. EPS growth can be part of that review, but it does not replace deeper analysis of cash flow, accounting quality, recurring profit, and balance-sheet support.
How to Use EPS Growth in Company Analysis
EPS growth is best used as a starting point for interpretation. It can show whether per-share earnings are improving, but the number needs to be traced back to its drivers before it carries analytical weight.
- Start with the EPS line and make sure the comparison period is consistent.
- Check whether the growth came from higher earnings, a lower share count, or both.
- Compare reported profit growth with operating cash flow.
- Look for one-time gains, unusual tax effects, or accounting changes.
- Review whether dilution, repurchases, or capital allocation changed the per-share result.
EPS growth is most useful when it helps frame the next question: whether the company’s per-share earnings improvement is repeatable, cash-supported, and consistent with the broader financial statement picture.
FAQ
What does EPS growth mean?
EPS growth means the percentage change in earnings per share from one period to another. It shows whether per-share earnings increased or decreased over the comparison period.
How do you calculate EPS growth?
EPS growth is calculated as ending EPS divided by beginning EPS, minus one. For example, if EPS rises from $2.00 to $2.40, EPS growth is 20%.
Is higher EPS growth always better?
No. Higher EPS growth needs to be checked against earnings quality, share-count changes, cash flow support, one-time items, and the starting period used in the comparison.
Should EPS growth use basic EPS or diluted EPS?
Either can be used, but the comparison should be consistent. Diluted EPS growth is often more conservative when potential shares or dilution are meaningful.