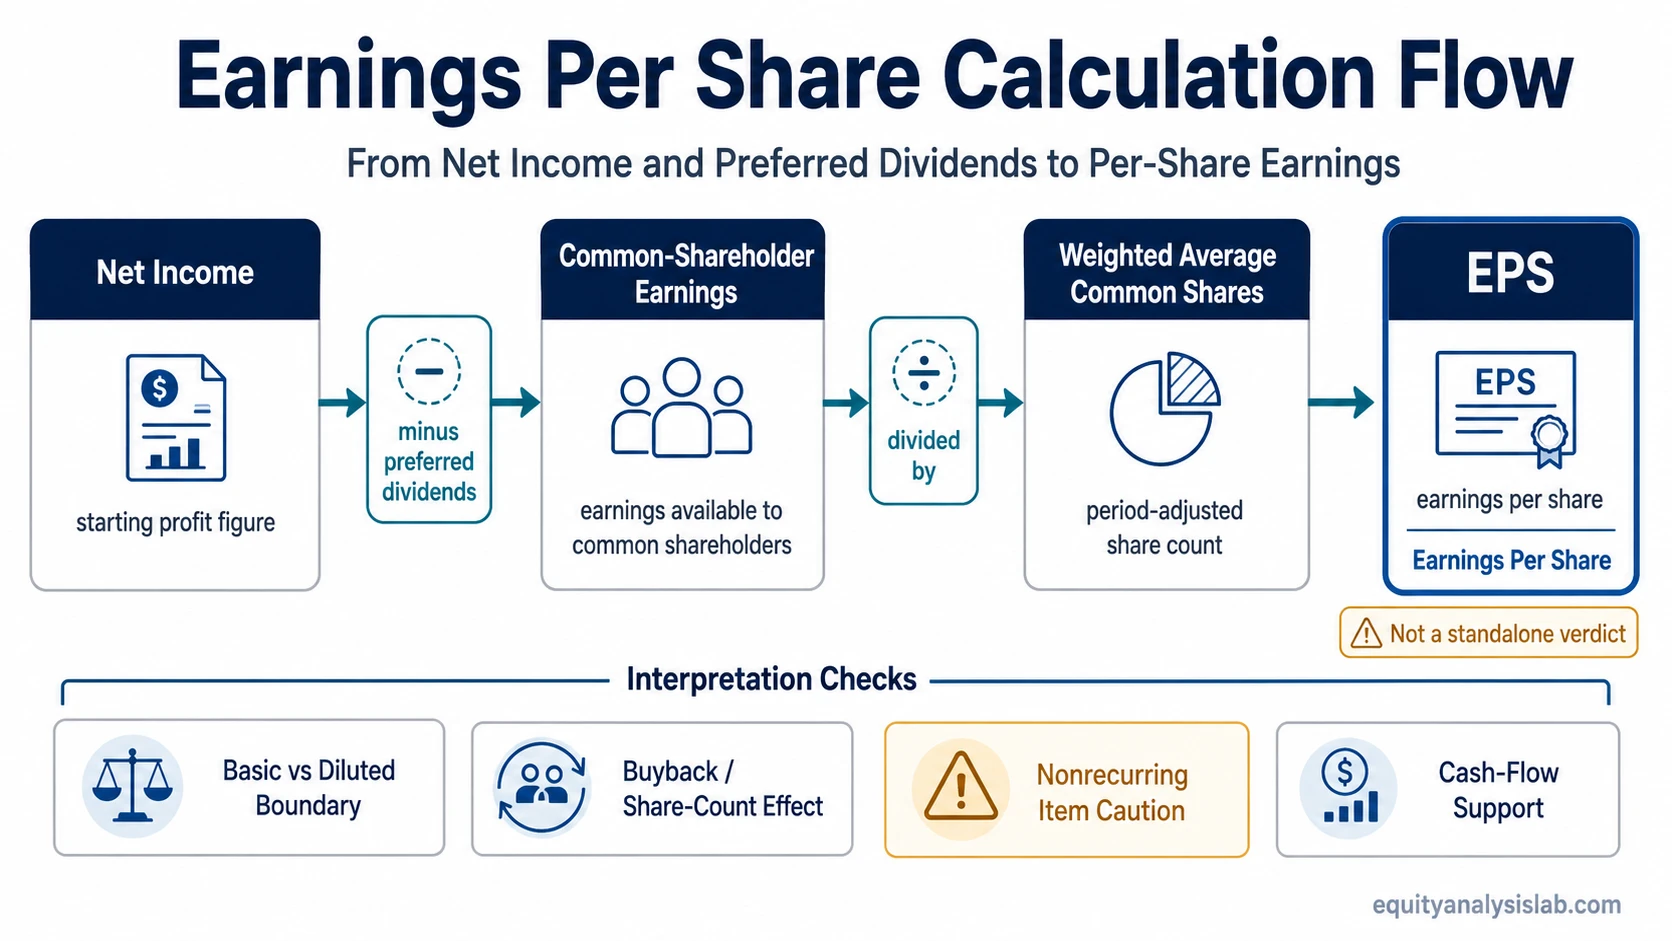
Earnings per share, or EPS, measures how much profit is attributable to each weighted average common share during a reporting period. The standard calculation starts with net income, subtracts preferred dividends when they apply, and divides the remaining amount by weighted average common shares outstanding.
EPS turns company-level earnings into a per-share figure. That makes it useful for comparing periods, checking whether share issuance or buybacks changed per-share economics, and connecting the income statement to shareholder ownership. It does not prove business quality, valuation attractiveness, or future returns by itself.
Key Points About Earnings Per Share
- EPS is an accounting and investor-analysis metric that expresses earnings attributable to common shareholders on a per-share basis.
- The basic EPS formula is usually net income minus preferred dividends, divided by weighted average common shares outstanding.
- EPS can rise because earnings improved, because the share count fell, or because accounting items changed reported profit.
- EPS should be checked against dilution, buybacks, nonrecurring items, accruals, and cash-flow support before it is interpreted as evidence of stronger business quality.
What Earnings Per Share Means
Earnings per share means the portion of a company’s earnings that belongs to each weighted average common share for a specific period. It is a per-share measure of accounting profit, not a complete measure of business value.
The calculation starts with total net income before narrowing the figure to earnings available to common shareholders. Preferred dividends are then removed because EPS focuses on earnings available to common shareholders. The remaining earnings are divided across the weighted average number of common shares that existed during the period.
The denominator controls how company-level profit is converted into a per-share amount. If the same company earns the same total profit but has fewer common shares outstanding, EPS can increase. If the company issues more shares while total profit stays flat, EPS can decline.
Earnings Per Share Formula
The standard EPS formula separates the earnings available to common shareholders from the number of common shares that shared in those earnings.
| Formula part | Meaning | Why it matters |
|---|---|---|
| Net income | Total profit after expenses, taxes, interest, and other accounting items for the period. | It is the starting point for earnings available to shareholders. |
| Preferred dividends | Dividends owed to preferred shareholders before common shareholders. | They are subtracted because common EPS focuses on common-shareholder earnings. |
| Weighted average common shares outstanding | The average number of common shares outstanding during the period, adjusted for timing. | It converts company-level earnings into a per-share figure. |
EPS formula:
Earnings per share = (Net income - Preferred dividends) / Weighted average common shares outstanding
The weighted average share count is used because the number of shares can change during the period. A company may issue shares, repurchase shares, split shares, or complete other capital-structure actions that affect the denominator.
How to Calculate Earnings Per Share
A simple EPS calculation uses three inputs: net income, preferred dividends, and weighted average common shares. The result is usually expressed as a currency amount per share.
Hypothetical example: Suppose a company reports $120 million of net income, pays $10 million of preferred dividends, and has 55 million weighted average common shares outstanding.
($120 million - $10 million) / 55 million shares = $2.00 EPS
In this example, $110 million is available to common shareholders. Dividing that amount by 55 million weighted average common shares produces earnings per share of $2.00.
The example is intentionally simple. Real filings may include separate basic and diluted share counts, discontinued operations, noncontrolling interests, nonrecurring items, or adjusted earnings presentations. Those details can change how EPS is interpreted even when the headline number appears straightforward.
Where EPS Appears in Financial Reports
EPS is commonly presented with the income statement or earnings statement in periodic company reports. Companies often disclose both basic and diluted EPS, along with the share counts used in the calculation.
The observable items to check are the numerator, the share-count denominator, the period covered, and whether the figure is basic, diluted, reported, or adjusted. The label matters because different EPS figures answer different questions.
Filing check: When reviewing EPS, compare the income statement, earnings notes, share-count footnotes, and cash-flow statement. A headline EPS figure is easier to interpret when the surrounding statements support the same economic story.
Basic EPS vs Diluted EPS
Basic EPS uses the weighted average common shares currently outstanding. It does not assume that potentially dilutive securities become common shares.
A diluted earnings per share calculation includes the effect of potentially dilutive instruments when they reduce EPS. Examples can include stock options, restricted stock units, convertible debt, or convertible preferred shares, depending on the company’s capital structure and accounting treatment.
The distinction matters because basic EPS can look stronger than diluted EPS when a company has meaningful potential dilution. For companies with simple capital structures, the difference may be small. For companies with many share-based awards or convertible instruments, the gap can be more important.
What EPS Shows and What It Does Not Show
EPS can help investors understand whether accounting earnings are increasing or decreasing on a per-share basis. That per-share framing is useful because shareholders do not own the company in the abstract. They own a claim represented by shares.
EPS can also help separate total company growth from per-share economics. A company may increase total net income while issuing enough shares that each share’s claim on earnings grows more slowly. In the opposite direction, a company may report flat net income while buybacks reduce the share count and raise EPS mechanically.
For trend analysis, EPS becomes more useful when the reader also checks growth in per-share earnings, margin movement, share-count changes, and the cash-flow support behind reported profit.
What EPS Can Hide
EPS can be informative, but it can also compress many different accounting and capital-structure effects into one number. That makes it easy to overread if the surrounding evidence is ignored.
EPS does not prove business quality by itself. A higher EPS figure may reflect better operations, a lower share count, a one-time gain, a tax effect, cost cuts, accounting classification, or a mix of several factors. The number needs context before it can support a stronger conclusion.
| EPS change | Possible explanation | Interpretation check |
|---|---|---|
| EPS rises | Net income increased. | Check whether revenue, margins, and cash flow support the improvement. |
| EPS rises | Share count declined after buybacks. | Check whether buybacks were funded sustainably and whether total earnings also improved. |
| EPS falls | Share count increased after issuance or stock compensation. | Check whether dilution offset operating progress. |
| EPS changes sharply | Nonrecurring gains, losses, impairments, tax effects, or restructuring items affected net income. | Separate recurring operating earnings from unusual accounting items where filings allow it. |
| EPS looks strong but cash flow is weak | Accruals, working-capital timing, or accounting recognition may be affecting reported profit. | Compare EPS with operating cash flow and free cash flow before treating the result as durable. |
How to Interpret EPS Safely
A safer EPS reading starts with the formula and then moves outward. First, identify the earnings numerator. Second, check whether preferred dividends or other claims affect common-shareholder earnings. Third, review the weighted average share count. Fourth, compare basic and diluted figures. Fifth, check cash flow and nonrecurring items.
This sequence prevents a common mistake: treating EPS as a final verdict rather than a starting point. EPS can anchor analysis only when earnings quality, durability, share-count context, and cash-flow support all point in a consistent direction.
EPS interpretation sequence:
- Confirm the reported EPS type: basic, diluted, adjusted, trailing, or forward.
- Check the numerator: net income, preferred dividends, and unusual items.
- Check the denominator: weighted average shares and share-count changes.
- Compare EPS to cash flow, not only to prior-period EPS.
- Use EPS as one input, not as a standalone valuation or investment decision.
Related EPS Concepts
EPS connects to several nearby concepts, but each one answers a different question. Keeping those boundaries clear prevents one broad EPS explanation from absorbing more specific analysis.
Use basic EPS when the question is the current common-share earnings calculation without assumed dilution.
Use diluted EPS when the question is how options, convertibles, restricted stock units, or similar instruments could reduce per-share earnings.
Use EPS growth when the question is whether per-share earnings are improving or weakening over time.
Use quality of earnings analysis when the question is whether reported earnings are durable, recurring, and cash-flow supported.
FAQ
Is higher EPS always better?
No. Higher EPS can reflect stronger earnings, but it can also result from buybacks, unusual accounting items, lower tax expense, or other non-operating factors. EPS should be checked against share count, dilution, recurring earnings quality, and cash flow.
Why can EPS increase when a business does not improve?
EPS can increase mechanically if the share count falls through buybacks or if a one-time gain lifts net income. That is why EPS interpretation should separate operating improvement from accounting effects and capital-structure changes.
What is the difference between basic EPS and diluted EPS?
Basic EPS uses weighted average common shares currently outstanding. Diluted EPS includes the effect of potentially dilutive securities when they reduce per-share earnings. The gap can matter when a company has options, convertibles, or other instruments that may become common shares.