
Free float is the portion of a company’s outstanding shares that is treated as available for public trading after holdings classified as non-free-float are excluded.
The number describes the tradable part of the current share base. The exact exclusions can vary by index provider, data vendor, market, and regulatory context.
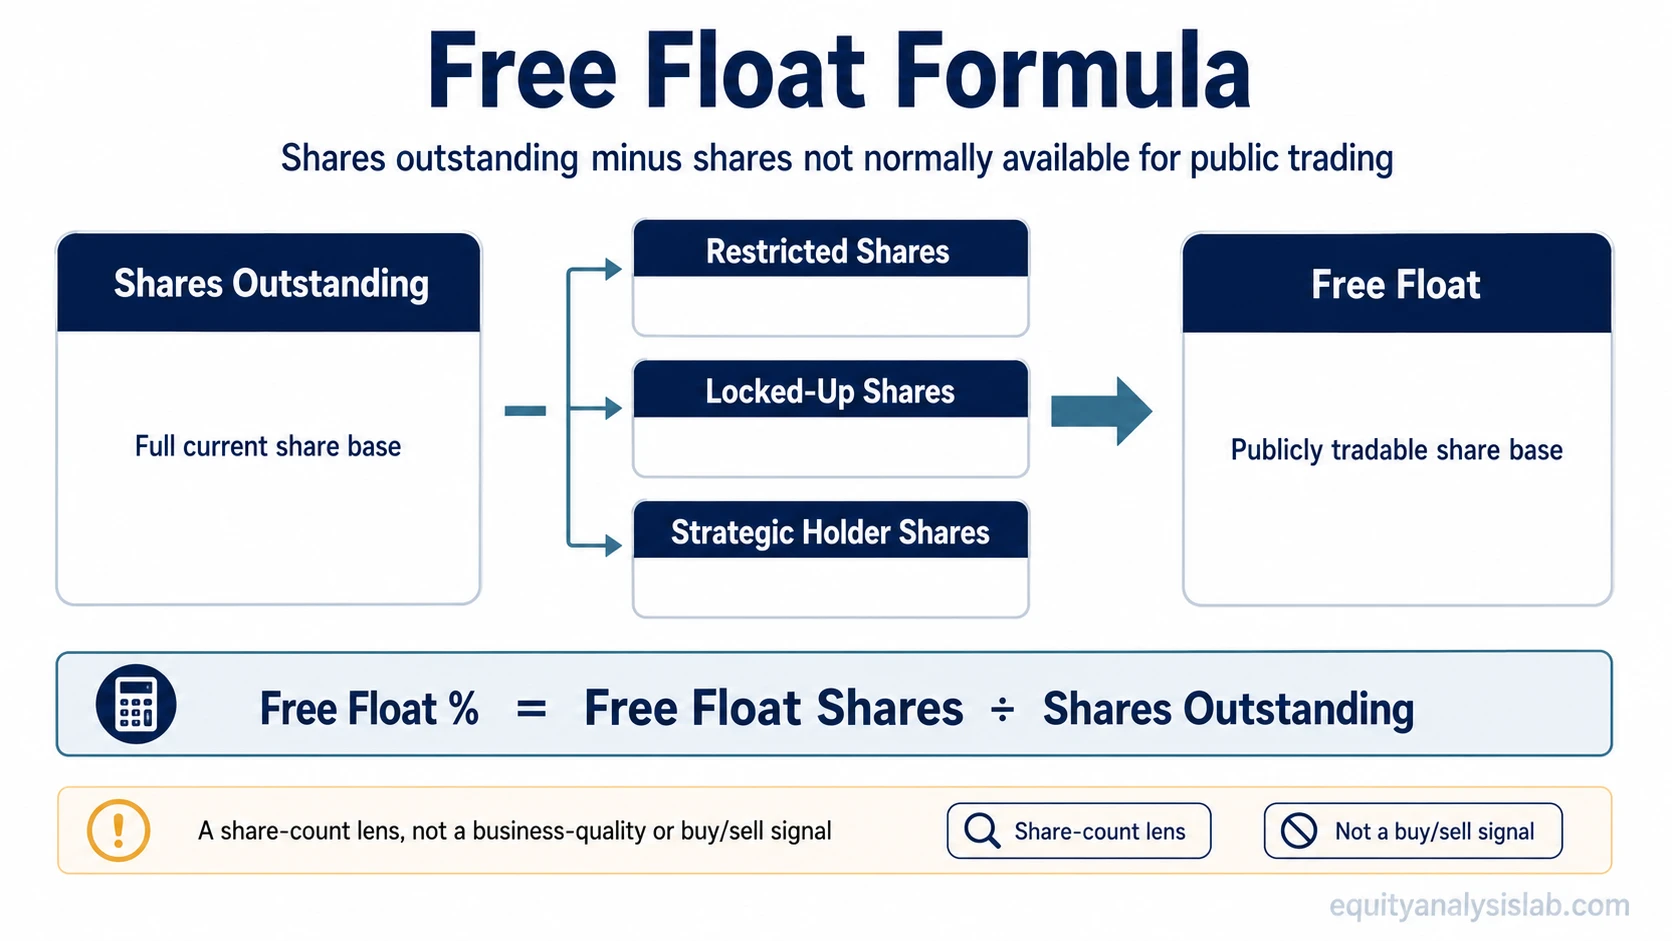
How Free Float Is Calculated
The cleanest general calculation starts with shares outstanding and subtracts shares classified as non-free-float under the methodology being used.
Free float shares = shares outstanding − shares classified as non-free-float
Free float percentage = free float shares ÷ shares outstanding × 100
For example, a company with 100 million shares outstanding and 30 million shares classified as non-free-float has 70 million free-float shares. Its free-float percentage is 70%.
Index providers and data vendors can classify strategic, controlling, government, restricted, or other holdings differently. A float figure should therefore be read together with the methodology that produced it rather than treated as a universal accounting number.
What Is Included and Excluded From Free Float?
The analytical boundary is public trading availability. Shares available to ordinary market participants generally belong in the float, while holdings treated as restricted or strategically unavailable are excluded under the applicable methodology.
| Share category | Typical treatment | What to check |
|---|---|---|
| Publicly tradable shares | Included | These shares form the normal public trading base. |
| Restricted or locked-up shares | Usually excluded while unavailable | Check when the restriction expires and whether the methodology changes their classification at that point. |
| Founder, controlling, or strategic holdings | Often excluded | Provider rules determine which holdings are considered strategic or controlling. |
| Government strategic stakes | Often excluded | Treatment depends on the methodology and the nature of the holding. |
| Treasury stock | Outside the outstanding-share base | If the calculation starts with shares outstanding, treasury stock should not be subtracted a second time. |
Free Float, Public Float, and Source Context
In market-data and index contexts, the terms free float and public float are often used for the publicly tradable portion of a share base. The source still matters because the same terminology can be used differently in regulatory reporting.
Free-float data commonly describes shares or a percentage of shares available to public investors. In U.S. SEC filing contexts, public float is generally a market-value calculation based on common equity held by non-affiliates. Check the source definition before comparing the two.
Free Float and Shares Outstanding
Shares outstanding describes the current common-share ownership base. Free float describes the subset of that base treated as available for normal public trading.
Measures the common shares currently outstanding and held by shareholders.
Measures the portion of that outstanding share base treated as available for public trading.
A company can therefore have a large outstanding share count and a much smaller tradable float. For the dedicated side-by-side treatment, see shares outstanding vs free float.
Why Free Float Matters for Investors
Free float helps separate the company’s full current ownership base from the shares that are treated as available to public-market investors.
A smaller tradable base can make trading conditions more sensitive to changes in order flow, although float alone does not determine liquidity or volatility. Trading volume, market depth, ownership concentration, demand, and market conditions also matter.
Free float also affects some index calculations. Float-adjusted indices use an investable or available-float factor so that strategic or otherwise unavailable holdings do not receive the same index weight as shares considered available to public investors.
What Can Change Free Float?
A change in free float can come from a change in the number of shares outstanding, a change in who owns existing shares, or a change in how those holdings are classified.
| Event | Possible effect on shares outstanding | Possible effect on free float |
|---|---|---|
| Lock-up expiration | Usually unchanged | Can increase if previously restricted shares become freely tradable. |
| Strategic holder sell-down | Unchanged | Can increase if shares move from a non-free-float holder into public ownership. |
| New share issuance | Can increase | Can increase, although the effect depends on who receives the shares and any restrictions. |
| Share repurchase | Can decrease | Can change depending on which shares are repurchased and how the provider treats the resulting share base. |
| Ownership or methodology reclassification | Unchanged | The reported free float can change even though no new shares were issued or cancelled. |
Free Float and Dilution
Free float and dilution belong to the same share-structure analysis, but they describe different changes.
Changes the portion of the existing share base treated as available for public trading.
Changes ownership or per-share economics when the relevant share base expands.
A lock-up expiration or strategic sell-down can increase free float while shares outstanding remain unchanged. New issuance can affect both measures. Keeping those paths separate prevents a change in trading availability from being mistaken for new-share creation.
Limits of Free-Float Analysis
A high or low float does not establish business quality, valuation, expected return, or future volatility by itself. The figure is most useful when combined with ownership structure, trading conditions, the source methodology, and the reason the float changed.
A Simple Free Float Example
Example: A company has 200 million shares outstanding. If 100 million shares are classified as non-free-float because of strategic ownership or current restrictions, the remaining 100 million shares form the reported free float under that methodology.
The outstanding share count is still 200 million. The 100 million free-float figure answers a different question: how much of that current share base is treated as available for public trading.
Related Share-Structure Concepts
Use the current outstanding share count to understand the ownership base before separating the tradable subset.
Diluted shares outstanding adds the applicable potential-share effect used for diluted per-share analysis.
Dilutive securities identifies instruments or arrangements that can create potential common shares.
Share dilution focuses on the ownership or per-share effect of an expanded share base.
How to Use Free Float in Company Analysis
Start with the current shares outstanding rather than authorized shares or a fully diluted future-share estimate.
Identify which holder types, restrictions, and strategic stakes the data source classifies as non-free-float.
Separate restrictions and ownership classifications from actual changes in the number of shares outstanding.
Determine whether the float moved because shares were issued or repurchased, existing holders changed, restrictions expired, or the source reclassified ownership.