Gross margin shows how much revenue remains after direct production or service costs, while operating margin shows how much revenue remains after the company’s operating expense structure is included.
Gross margin is mainly a product or service economics measure. It asks whether the company can sell what it offers for meaningfully more than the direct cost of delivering it.
Operating margin goes one layer lower in the income statement. It asks whether the company still keeps enough profit after sales, marketing, research, administration, and other operating expenses are included.
Gross Margin vs Operating Margin: The Core Difference
Gross margin stops at the direct-cost layer. Operating margin continues through the operating expense layer before interest and taxes.
Gross margin: revenue minus cost of goods sold or direct service costs, divided by revenue.
Operating margin: operating income divided by revenue, after operating expenses are included but before interest and taxes.
A high gross margin can show that the core product or service has attractive direct economics. It does not prove that the full business model is efficient. A weaker operating margin may show that overhead, sales costs, product development, or administrative costs absorb much of the gross profit.
How Gross Margin and Operating Margin Use Different Cost Layers
Gross margin begins with revenue and subtracts the costs directly tied to producing goods or delivering services. For a manufacturer, that may include materials and production labor. For a software or service business, the direct-cost boundary depends on how the company classifies hosting, support, delivery, and service costs.
Operating margin starts after gross profit and then subtracts operating expenses. These expenses often include sales and marketing, research and development, general and administrative costs, and other recurring operating costs. The result is operating income as a percentage of revenue.
| Metric | Compact formula logic | Main cost boundary | Investor question answered |
|---|---|---|---|
| Gross margin | (Revenue minus direct costs) divided by revenue | Direct production or service delivery costs | Does the company keep enough profit after direct costs? |
| Operating margin | Operating income divided by revenue | Direct costs plus operating expenses | Does the company keep enough profit after running the operating structure? |
The two margins are connected but not interchangeable. Gross margin tests the economics of what the company sells. Operating margin tests whether the business can preserve those economics after funding the organization around the product or service.
Gross Margin vs Operating Margin Comparison Table
| Comparison point | Gross margin | Operating margin |
|---|---|---|
| Main focus | Product, service, or delivery economics | Full operating profitability before financing and taxes |
| Income statement layer | Revenue to gross profit | Revenue to operating income |
| Costs included | Direct costs such as cost of goods sold or cost of revenue | Direct costs plus operating expenses such as sales, marketing, R&D, and G&A |
| What it can reveal | Pricing power, production efficiency, service delivery cost, or product mix | Expense discipline, scale efficiency, operating leverage, or structural overhead burden |
| Common misuse | Treating strong product economics as proof that the whole company is profitable | Treating operating profitability as a full cash-flow or valuation conclusion |
| Best comparison base | Similar companies, similar accounting treatment, and the company’s own history | Similar business models, similar operating maturity, and the company’s own history |
Same-Company Example: Strong Product Economics, Weak Operating Structure
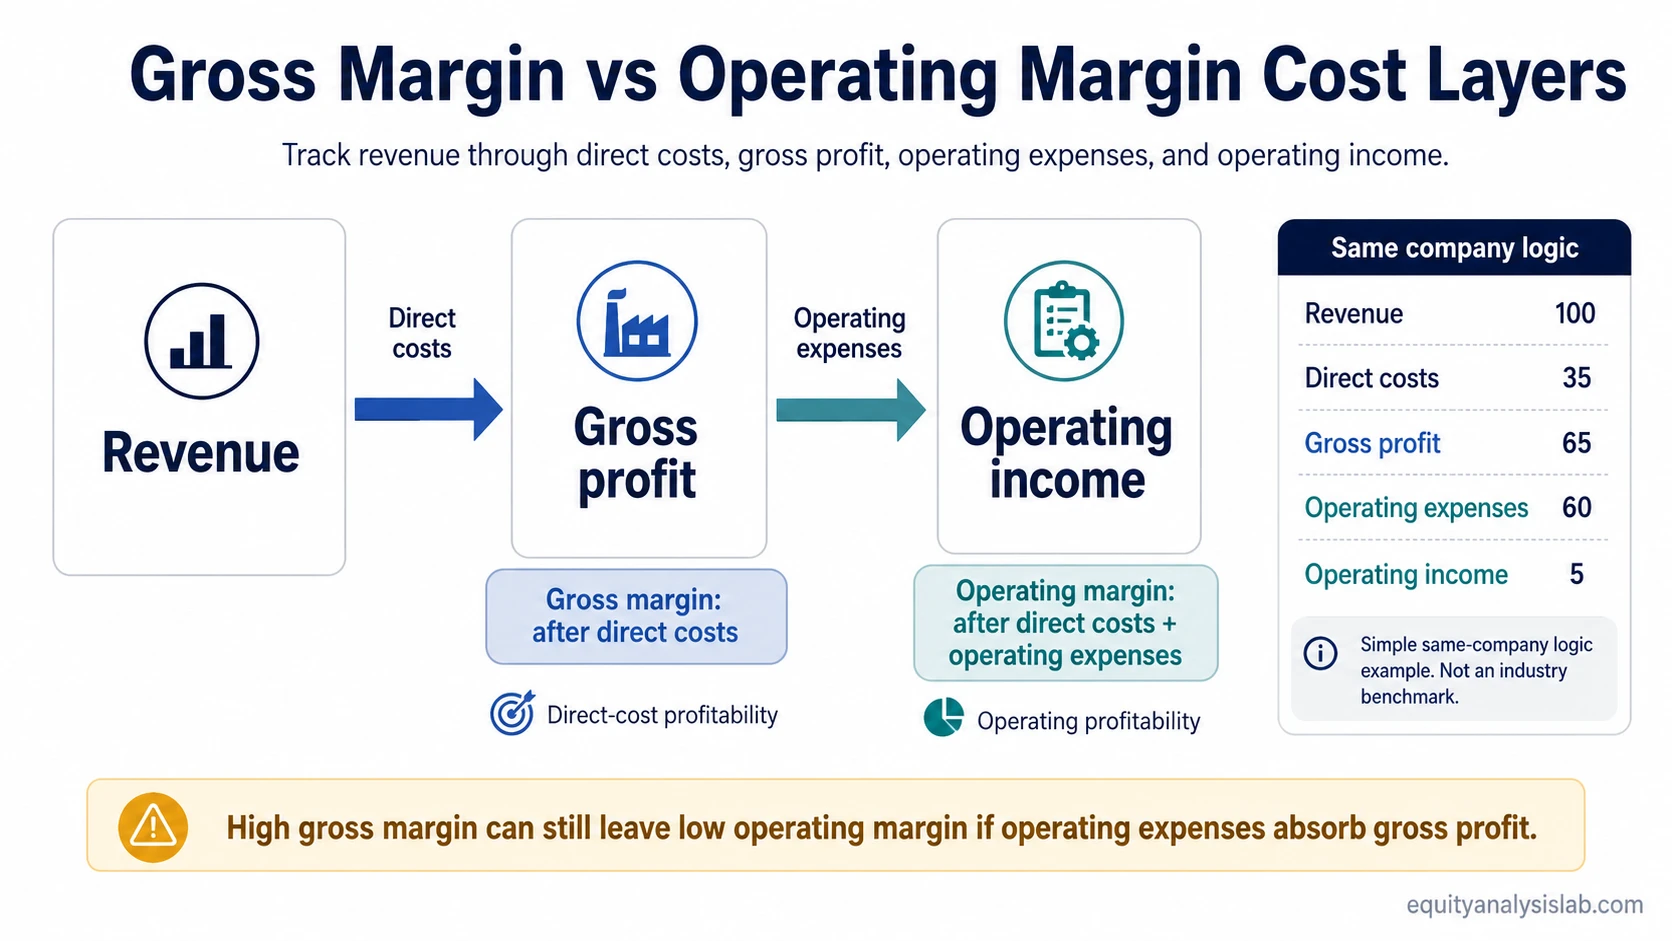
Assume a company has $100 million of revenue and $35 million of direct costs. Gross profit is $65 million, so gross margin is 65%.
If the same company also has $60 million of operating expenses, the picture changes. Operating income falls to $5 million, so operating margin is 5%.
| Line item | Amount | Margin effect |
|---|---|---|
| Revenue | $100 million | Starting base |
| Direct costs | $35 million | Leaves 65% gross margin |
| Gross profit | $65 million | Strong direct-cost economics |
| Operating expenses | $60 million | Consumes most gross profit |
| Operating income | $5 million | Leaves 5% operating margin |
That does not make gross margin irrelevant. It shows that the product or service can generate profit after direct costs. The operating margin adds a different diagnosis: the company’s expense base leaves little operating profit after the organization is funded.
When Gross Margin vs Operating Margin Can Mislead Investors
High gross margin can create false comfort. A company may have attractive direct-cost economics while still spending heavily to acquire customers, build products, support operations, or manage overhead. In that case, gross margin alone can make the business look stronger than the operating structure supports.
Operating margin also has limits. It does not include interest expense, taxes, capital spending, working-capital needs, or capital structure. It can also be affected by nonrecurring items, segment mix, accounting classification, or temporary cost controls.
Peer comparison matters. A margin level that looks high in one industry may be ordinary in another. Both metrics work best when compared against similar business models, similar accounting policies, and the same company’s margin history.
How Investors Should Use Both Margins Together
Gross margin is useful for checking whether the company’s core offering has room to absorb costs below the gross profit line. Operating margin is useful for checking whether that room survives the company’s expense structure.
A useful reading often comes from the spread between the two metrics. A wide gap between gross margin and operating margin can point to heavy operating expenses, investment in growth, weak scale efficiency, or a business still building the infrastructure needed to support revenue. The interpretation depends on whether those expenses are temporary, strategic, recurring, or structurally required.
Net margin can be useful later, but it answers a different question because it includes items below operating income. For the gross margin vs operating margin comparison, the cleaner distinction is direct-cost profitability versus operating profitability.
Key Points
- Gross margin focuses on revenue after direct costs.
- Operating margin focuses on revenue after direct costs and operating expenses.
- High gross margin does not automatically mean strong operating profitability.
- Operating margin is not a complete cash-flow or valuation measure.
- Both margins need industry, accounting, and company-history context.
Gross Margin vs Operating Margin FAQ
Is gross margin or operating margin more important?
Neither metric is universally more important. Gross margin is better for isolating direct product or service economics. Operating margin is better for judging whether those economics survive the company’s operating expense structure.
Can a company have high gross margin but low operating margin?
Yes. A company can keep a large share of revenue after direct costs but still spend heavily on sales, marketing, research, administration, or other operating expenses. That combination points to strong direct economics but weaker operating profitability.
Why should investors compare margins within the same industry?
Industries differ in direct costs, operating expense needs, accounting classification, and capital intensity. Comparing margins across unrelated business models can make a normal margin look unusually strong or weak.