
Expected return is a probability-weighted estimate of possible investment outcomes. It combines assumed returns with assumed probabilities before the result is known, so the number depends on the quality of the assumptions behind it.
Expected return can help compare scenarios and make assumptions visible, but it does not describe the full range of possible outcomes. Two investments can have the same expected return while carrying very different downside exposure.
Expected return is the average return an investment or scenario would be expected to produce if the assumed probabilities and outcomes were accurate over repeated observations.
The estimate is not the return that should occur in any single period. An investment with a 7.25% expected return can still produce a much higher return, a lower return, a loss, or an outcome outside the assumed range.
Key Points
- Expected return combines possible returns with assumed probabilities.
- The result is a weighted average, not a guaranteed future return.
- Changing one probability assumption can materially change the expected return.
- Two scenarios can have the same expected return while having very different downside profiles.
- Expected return should be read together with the range and distribution of possible outcomes.
What Expected Return Means
Expected return combines possible investment outcomes with the probability assigned to each outcome. The calculation is made before the actual result is known, so both the outcome range and the probabilities are assumptions.
Its analytical value comes from making those assumptions explicit. Instead of saying that an investment has attractive return potential, the investor has to specify what outcomes are possible, how likely each outcome is assumed to be, and how much each scenario contributes to the average estimate.
Expected return can be calculated for an individual investment or used as an input in a portfolio framework. In either case, the output is only as useful as the assumptions used to construct it.
Expected Return Formula
The expected return formula multiplies each possible return by its assumed probability and then adds the weighted outcomes together.
Expected Return = (Outcome 1 × Probability 1) + (Outcome 2 × Probability 2) + … + (Outcome n × Probability n)
| Formula Element | Meaning |
|---|---|
| Outcome return | The possible return in one scenario. |
| Probability | The assumed chance that the scenario occurs. |
| Weighted outcome | The scenario return multiplied by its assumed probability. |
| Expected return | The sum of all weighted outcomes. |
Probabilities must use a consistent format in the calculation. For example, a probability of 40% is entered as 0.40.
How Expected Return Is Calculated
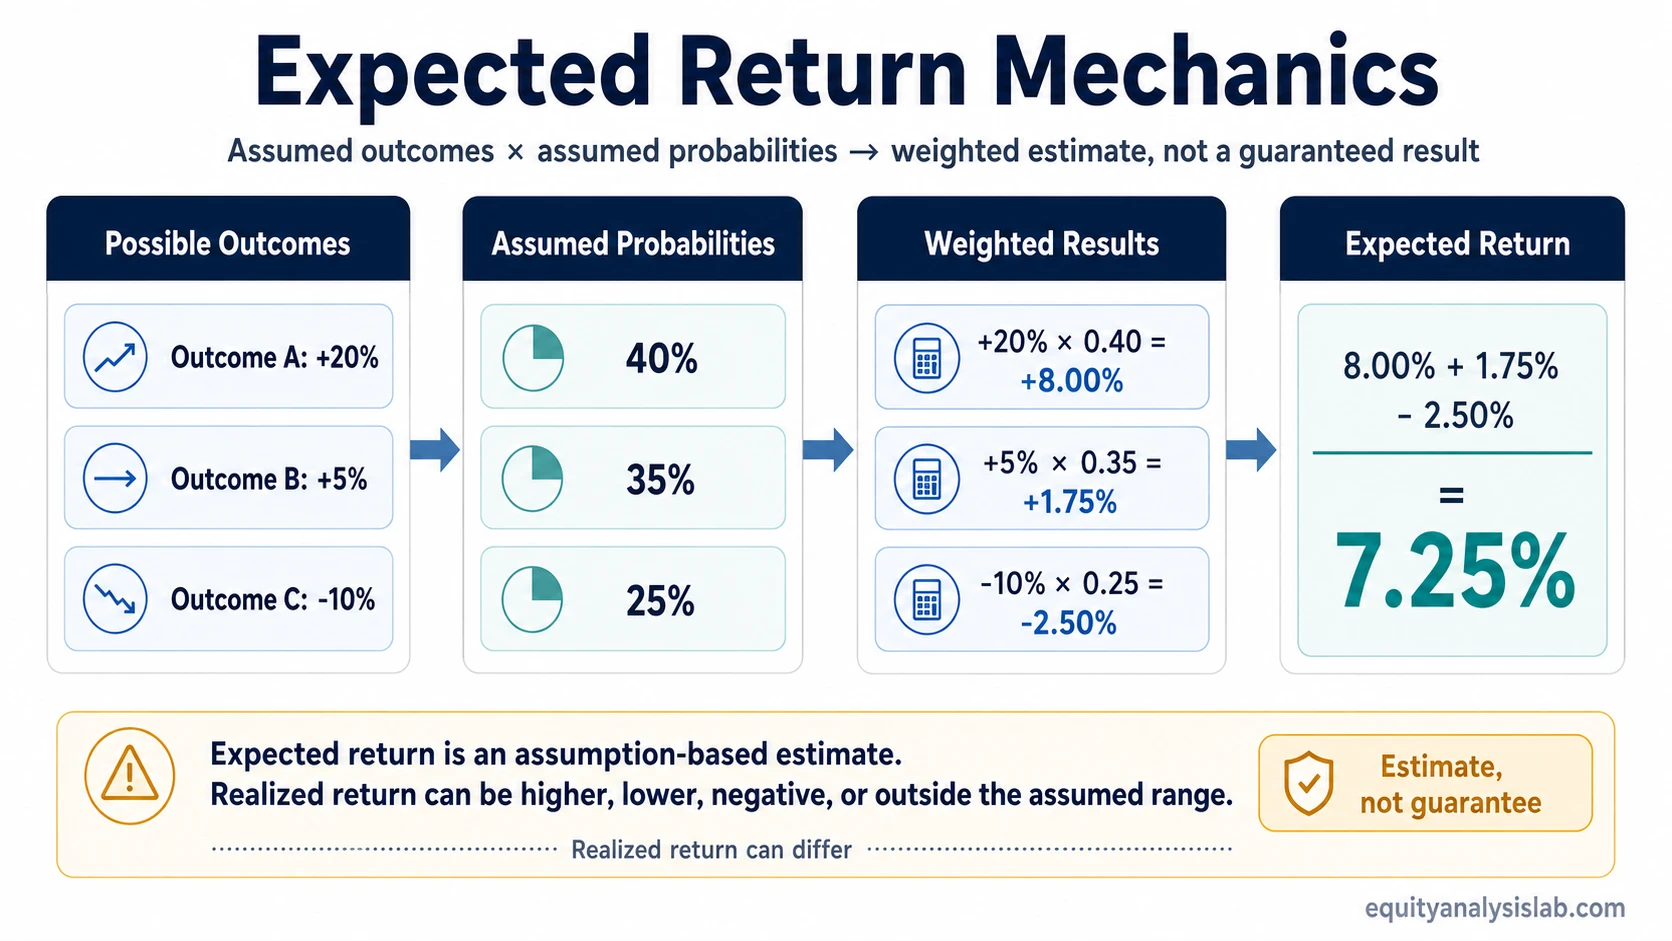
Assume an investment scenario has three possible outcomes:
| Possible Outcome | Assumed Probability | Weighted Result |
|---|---|---|
| +20% | 40% | 20% × 0.40 = 8.00% |
| +5% | 35% | 5% × 0.35 = 1.75% |
| -10% | 25% | -10% × 0.25 = -2.50% |
| Expected return | 100% | 7.25% |
The expected return is 7.25% because the weighted results are added together:
8.00% + 1.75% – 2.50% = 7.25%
The 7.25% number is the weighted average of the assumed scenarios. It is not another scenario that must occur.
How Probability Assumptions Change Expected Return
The outcome returns can stay exactly the same while the expected return changes materially if the probability assumptions change.
Start with the original scenario:
| Outcome | Original Probability | Revised Probability |
|---|---|---|
| +20% | 40% | 30% |
| +5% | 35% | 35% |
| -10% | 25% | 35% |
The revised calculation becomes:
20% × 0.30 + 5% × 0.35 + (-10%) × 0.35
= 6.00% + 1.75% – 3.50%
= 4.25%
Expected return falls from 7.25% to 4.25% even though none of the possible return outcomes changed. Only the assumed probability distribution changed.
Sensitivity lesson: expected return can look precise while remaining highly sensitive to probability assumptions that cannot be known with certainty in advance.
Same Expected Return, Different Outcome Distribution
The expected return alone does not show how the possible outcomes are distributed. Two scenarios can produce the same average while exposing the investor to very different downside conditions.
| Comparison | Scenario A | Scenario B |
|---|---|---|
| Outcome 1 | +12% with 50% probability | +15% with 80% probability |
| Outcome 2 | +4% with 50% probability | -20% with 20% probability |
| Expected return | 8.0% | 8.0% |
| Probability of loss in the assumed scenarios | 0% | 20% |
| Worst assumed outcome | +4% | -20% |
Scenario A: 12% × 0.50 + 4% × 0.50 = 8.0%
Scenario B: 15% × 0.80 + (-20%) × 0.20 = 8.0%
Both scenarios have an expected return of 8.0%, but the assumed distributions are not equivalent. Scenario B contains a 20% probability of losing 20%, while Scenario A contains no negative outcome within the simplified scenario set.
Interpretation: expected return compresses an assumed distribution of outcomes into one average. The average can remain unchanged while the downside structure changes materially.
Expected Return vs Realized Return
Expected return and realized return answer different questions. Expected return is calculated before the result is known. Realized return is the actual result after the investment period has occurred.
| Concept | When It Is Known | What It Represents | Main Limitation |
|---|---|---|---|
| Expected return | Before the outcome | A probability-weighted estimate based on assumptions | Depends on the assumed probabilities and outcome range |
| Realized return | After the outcome | The actual investment return that occurred | One realized result does not prove whether the original expectation framework was well constructed |
A positive expected return can therefore coexist with a negative realized result. The expected value describes the assumptions before the outcome, while realized return records what actually happened.
Why Expected Return Can Mislead
Expected return becomes less informative when the assumed probabilities are fragile, important scenarios are excluded, or the possible outcomes are too narrowly defined. The sensitivity example above shows that changing only the probability assigned to downside can move the expected return from 7.25% to 4.25%.
The average also hides the shape of the outcome distribution. Two investments can have identical expected returns while differing materially in their probability of loss and worst assumed outcome.
Historical averages can help inform assumptions, but they do not make future probabilities known. Business conditions, valuation, interest rates, earnings durability, market structure, and other variables can change the relationship between past and future outcomes.
Boundary: expected return summarizes an assumed average. It does not independently measure downside severity, uncertainty, business quality, valuation, or whether an investment is suitable for a particular investor.
How Investors Use Expected Return
Expected return is most useful as a comparison and assumption-testing tool. It can show whether one investment case depends on aggressive probabilities, how much a downside scenario contributes to the average, or how changes in assumptions alter the estimated payoff.
A contribution plan such as dollar-cost averaging controls how capital is deployed over time, while expected return describes the assumed outcome profile of the investment.
Expected return can interact with compounding when returns are reinvested over long periods, but the compounding path ultimately depends on the returns that are actually realized.
The expected average becomes more informative when it is considered beside uncertainty, downside, and dispersion. That broader relationship belongs to the relationship between risk and return, because expected return alone does not describe the full distribution of possible investment outcomes.
FAQ
What is expected return in investing?
Expected return is a probability-weighted estimate of possible investment outcomes. It multiplies each assumed return by its assumed probability and adds the weighted results together.
Is expected return guaranteed?
No. Expected return is an estimate based on assumptions. The realized return can be higher, lower, negative, or outside the scenarios used in the calculation.
Can two investments have the same expected return but different risk?
Yes. Two scenarios can produce the same expected return while having different probabilities of loss, downside severity, and outcome distributions. The expected average does not show those differences by itself.