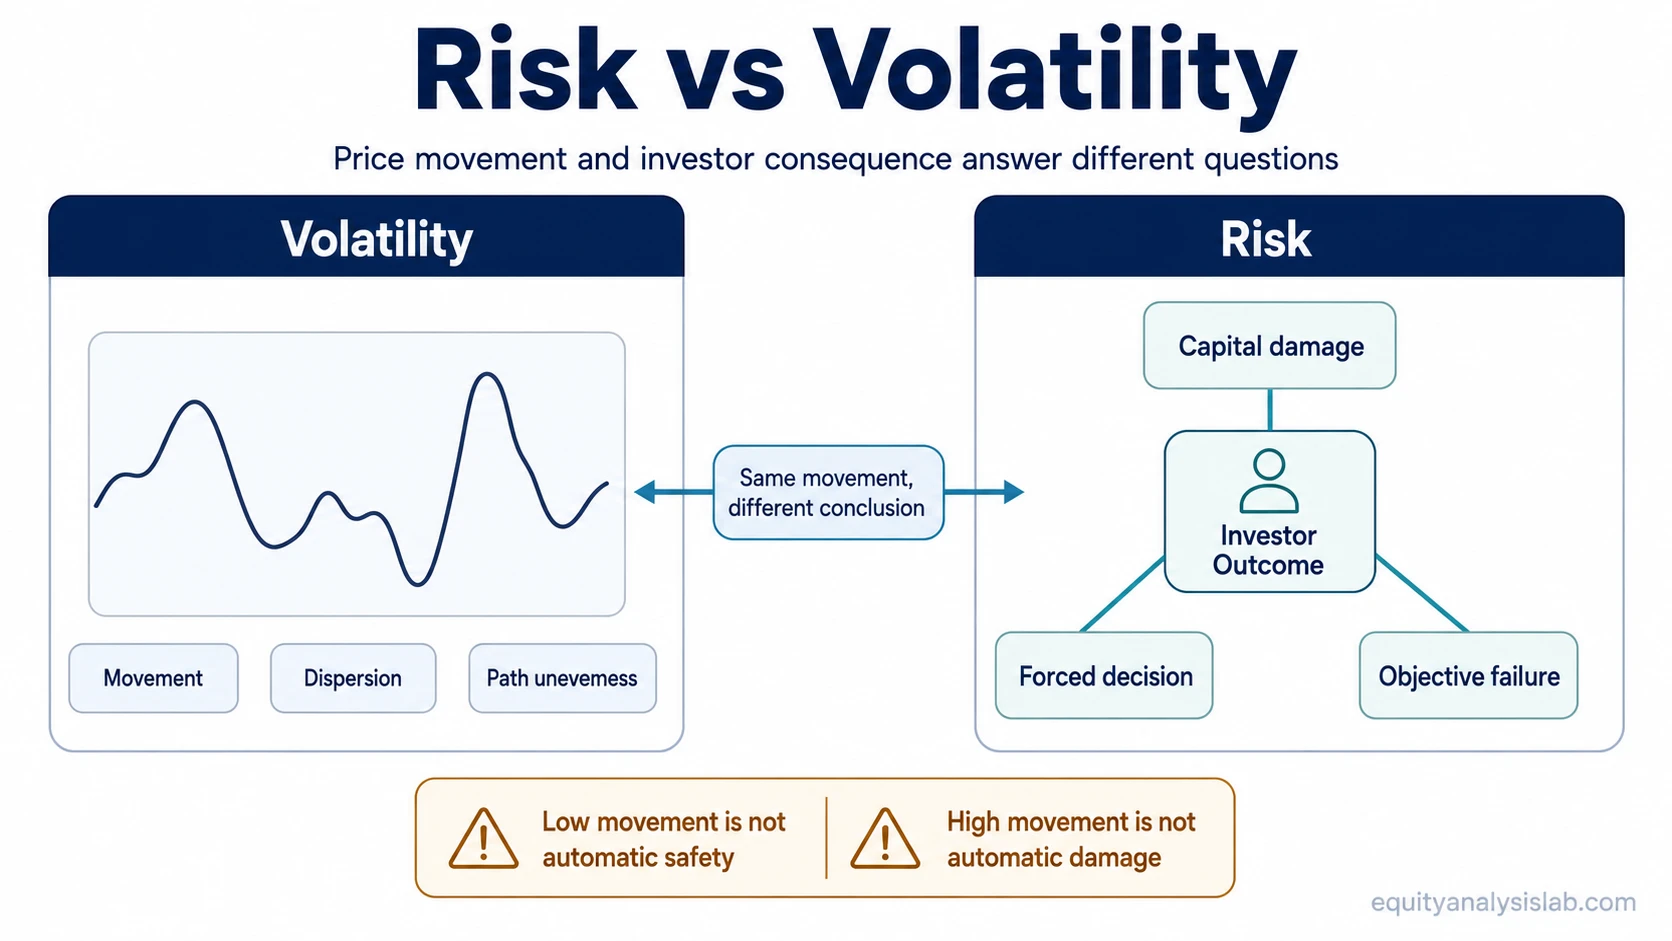
Risk and volatility may appear near each other, but they answer different investor questions. Volatility describes how uneven the price path is. Risk describes what can damage capital, force a poor decision, or prevent an investment from meeting its intended objective.
The useful distinction is not whether price movement feels comfortable. What matters is whether the movement changes the investor’s actual outcome. A volatile price can be uncomfortable without permanently impairing value, while a calm price can hide leverage, weak cash flow, excessive valuation, liquidity pressure, or concentration risk.
Core distinction: Volatility measures movement. Risk measures damage, failure, or adverse consequence.
What Is the Difference Between Risk and Volatility?
Volatility is a path measure. It focuses on how much prices move, how quickly they move, and how uneven the return path feels. It is usually visible because it shows up in price charts, return dispersion, drawdowns, standard deviation, beta, or volatility indexes.
Risk is a consequence measure. It focuses on what can go wrong for the investor: permanent capital loss, impaired business value, forced selling, liquidity stress, excessive leverage, poor valuation, weak fundamentals, or a mismatch between the investment and the investor’s objective.
That is why volatility can be one input into risk analysis without being the whole risk analysis. Price movement can create pressure, but the real question is whether that pressure changes the capital base, the decision quality, or the probability of reaching the intended outcome.
Risk vs Volatility Comparison
| Criterion | Volatility | Risk | Investor interpretation |
|---|---|---|---|
| Question answered | How uneven is the price path? | What can damage the outcome? | A rough path is not automatically a bad outcome; a smooth path is not automatically a safe one. |
| Evidence source | Price changes, return dispersion, drawdowns, beta, implied volatility, or realized volatility. | Business quality, valuation, balance sheet, liquidity, cash flow, concentration, horizon, and investor constraints. | Volatility is usually easier to observe, while risk often requires interpretation beyond price alone. |
| Measurement / observability | Can often be summarized with statistical or market-based measures. | Cannot be fully reduced to one number because the relevant damage depends on context. | A volatility statistic can help, but it does not replace judgment about capital impairment or objective failure. |
| What can make it worse | Large price swings, fast repricing, uncertainty, lower liquidity, or concentrated short-term selling pressure. | Leverage, weak cash generation, overvaluation, dilution, refinancing pressure, forced selling, or poor fit with the investor’s time horizon. | The same price movement can mean different things depending on balance-sheet strength, valuation, and liquidity needs. |
| Why it can mislead | High volatility can make a fundamentally resilient asset look more dangerous than it is. | Low visible volatility can hide structural fragility until conditions change. | The mistake is treating the more visible signal as the more complete signal. |
| Closest related concept | Drawdown, return dispersion, beta, realized volatility, implied volatility. | Permanent impairment, liquidity risk, valuation risk, business risk, objective failure. | Risk and return connects risk to expected compensation, not only price movement. |
Why Investors Confuse Risk and Volatility
Investors often confuse risk and volatility because volatility is immediate. A falling price can be seen on a screen, felt in the portfolio value, and measured quickly. Structural risk is slower and less obvious. It may sit inside leverage, cash-flow weakness, customer concentration, refinancing needs, valuation assumptions, or liquidity constraints.
Common mistake: Treating low volatility as safety and high volatility as danger. Low volatility can hide risk when the underlying evidence is weak. High volatility can look severe even when the long-term impairment risk is limited by stronger fundamentals, sufficient liquidity, and a suitable horizon.
The confusion becomes sharper when investors use volatility as a shortcut for discomfort. Discomfort is real, but it is not the same as damage. A price path can be stressful without destroying the investment case. A quiet price path can become dangerous if it encourages complacency around hidden balance-sheet, liquidity, or valuation risk.
Same Portfolio, Different Conclusion
Illustrative scenario: Consider two portfolio positions. Position A has frequent price swings, but the underlying business has durable cash generation, modest leverage, and no near-term need to sell. Position B moves very little for a long period, but the business depends on refinancing, has thin cash flow, and carries a valuation that leaves little room for disappointment.
Position A may have higher volatility because the market keeps repricing it. That movement can still be manageable if the capital base, business evidence, and investor horizon remain intact. Position B may have lower visible volatility, but the risk can be higher if a small change in financing conditions or earnings quality would create lasting damage.
The same company data can also lead to different investor conclusions depending on the question being asked. A short-term liquidity need makes volatility more consequential because the investor may be forced to sell during a weak price path. A long-term ownership case depends more on whether business value, cash flow, and capital structure can survive the stress.
When Volatility Becomes Practically Risky
Volatility becomes practically risky when price movement creates a consequence the investor cannot absorb. That can happen when an investor needs liquidity soon, uses leverage, holds a concentrated position, faces margin pressure, or depends on a narrow time window. In those cases, a temporary price move can force a permanent decision.
This is where maximum drawdown can be useful. Drawdown does not capture every form of risk, but it helps show how deep the path loss became before recovery. A decline that looks tolerable in a long-term chart may be intolerable for an investor who must sell, rebalance, or meet liabilities during the decline.
The interpretation changes when volatility interacts with constraints. A price swing with no forced action is one problem. The same price swing with leverage, short liquidity needs, or weak evidence behind the asset is a different problem.
Why Volatility Is Not a Complete Risk Measure
Volatility is useful because it gives investors an observable signal. It can show path uncertainty, emotional pressure, and the range of recent price movement. The limitation is that many risks do not appear as high volatility before they matter.
Limitation: Volatility may miss tail risk, liquidity risk, leverage risk, valuation risk, dilution risk, and permanent impairment. It can also treat upside and downside movement too similarly when the investor’s real concern is loss of capital or forced action.
Risk analysis needs the price path and the evidence behind the asset. A sharp move may be noise, repricing, or early warning. A smooth path may reflect stability, delayed recognition, or hidden fragility. The distinction depends on what the movement means for future cash flows, financing, valuation, ownership dilution, and the investor’s ability to hold through uncertainty.
Permanent impairment matters because future gains build from the remaining base. When capital is damaged rather than merely marked down temporarily, the compounding base changes.
How to Use Both Concepts Together
A disciplined interpretation starts by separating the observable from the consequence. Volatility asks how uneven the path is. Risk asks what that uneven path can do to capital, decision quality, and objective fit.
| Investor question | Primary lens | What to check next |
|---|---|---|
| Is the price path unusually unstable? | Volatility | Recent price dispersion, drawdown depth, liquidity conditions, and whether the move is temporary or structural. |
| Can the investment case be permanently impaired? | Risk | Cash flow, balance sheet, valuation, dilution, business quality, and refinancing or liquidity pressure. |
| Could the investor be forced into a bad decision? | Risk and volatility together | Time horizon, leverage, portfolio concentration, liquidity need, and tolerance for path loss. |
A balanced interpretation treats volatility as one visible signal, then asks whether that signal creates real damage, exposes hidden fragility, or simply reflects an uneven path.
Related Concepts
The risk-and-return relationship explains why investors usually require compensation for bearing uncertainty. Risk vs volatility is narrower: it separates price movement from the possibility of capital damage or objective failure.
Maximum drawdown helps describe the depth of a path loss. It is useful for observing downside movement, but it still needs interpretation alongside business quality, valuation, liquidity, and investor constraints.
Compounding explains why permanent impairment can matter more than temporary price movement. Once the capital base is damaged, future growth starts from a smaller base.
FAQ
Is volatility the same as risk?
No. Volatility describes how much the price path moves. Risk describes what can damage capital, force a bad decision, or prevent the investment from meeting its intended objective.
Can low volatility still be risky?
Yes. Low visible price movement can still hide leverage, weak cash flow, liquidity pressure, excessive valuation, or concentration risk.
Is high volatility always bad?
No. High volatility can be uncomfortable, but it does not automatically mean permanent impairment. The interpretation depends on the underlying evidence, investor constraints, and time horizon.
When does volatility become a real risk?
Volatility becomes a real risk when it forces an investor to sell, rebalance, meet liabilities, cover leverage, or abandon an otherwise valid investment case during a weak price path.